环境搭建
调试环境
PHPStorm + PhpStudy + xdebug 插件
配置过程
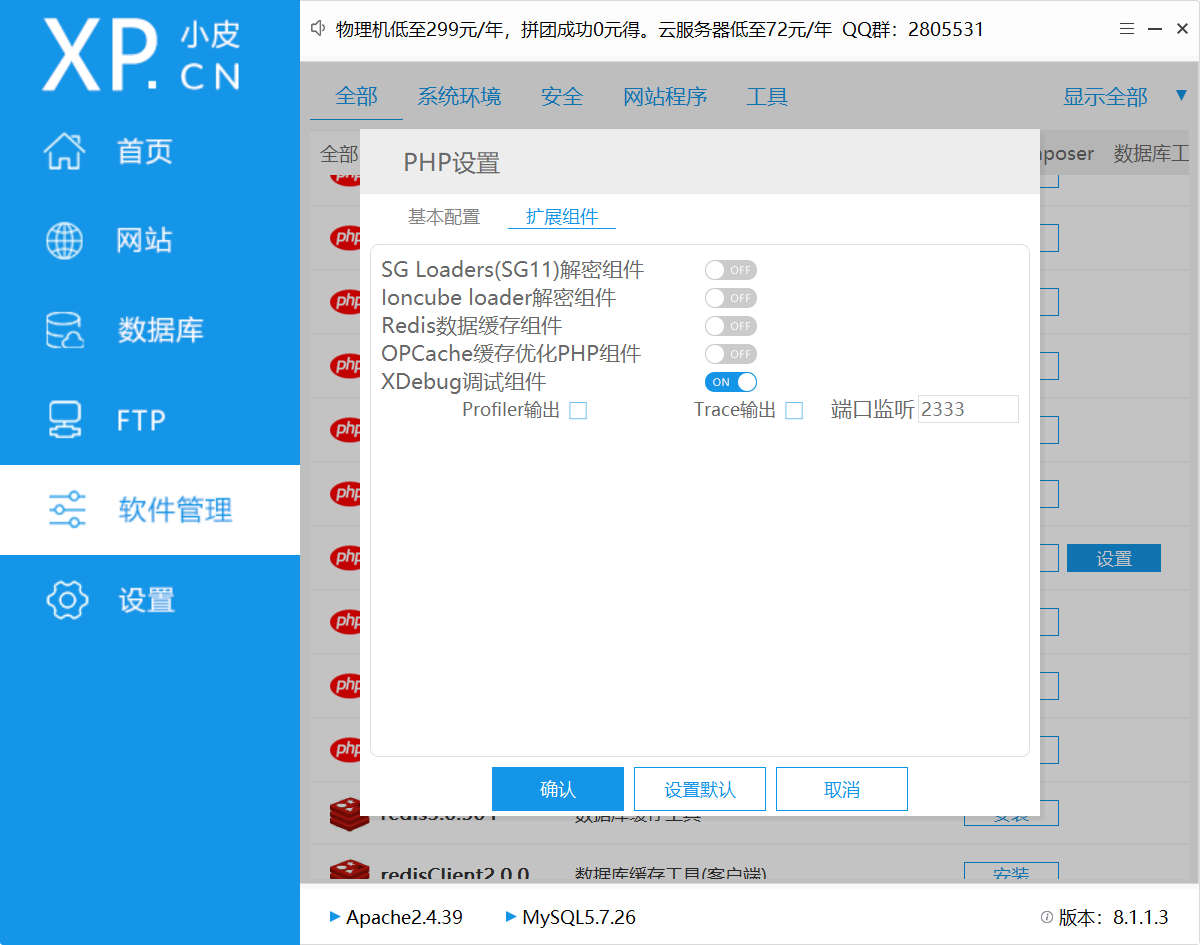
下载 PhpStudy,修改 php 版本的配置。
手动修改 php.ini 文件,配置远程连接。
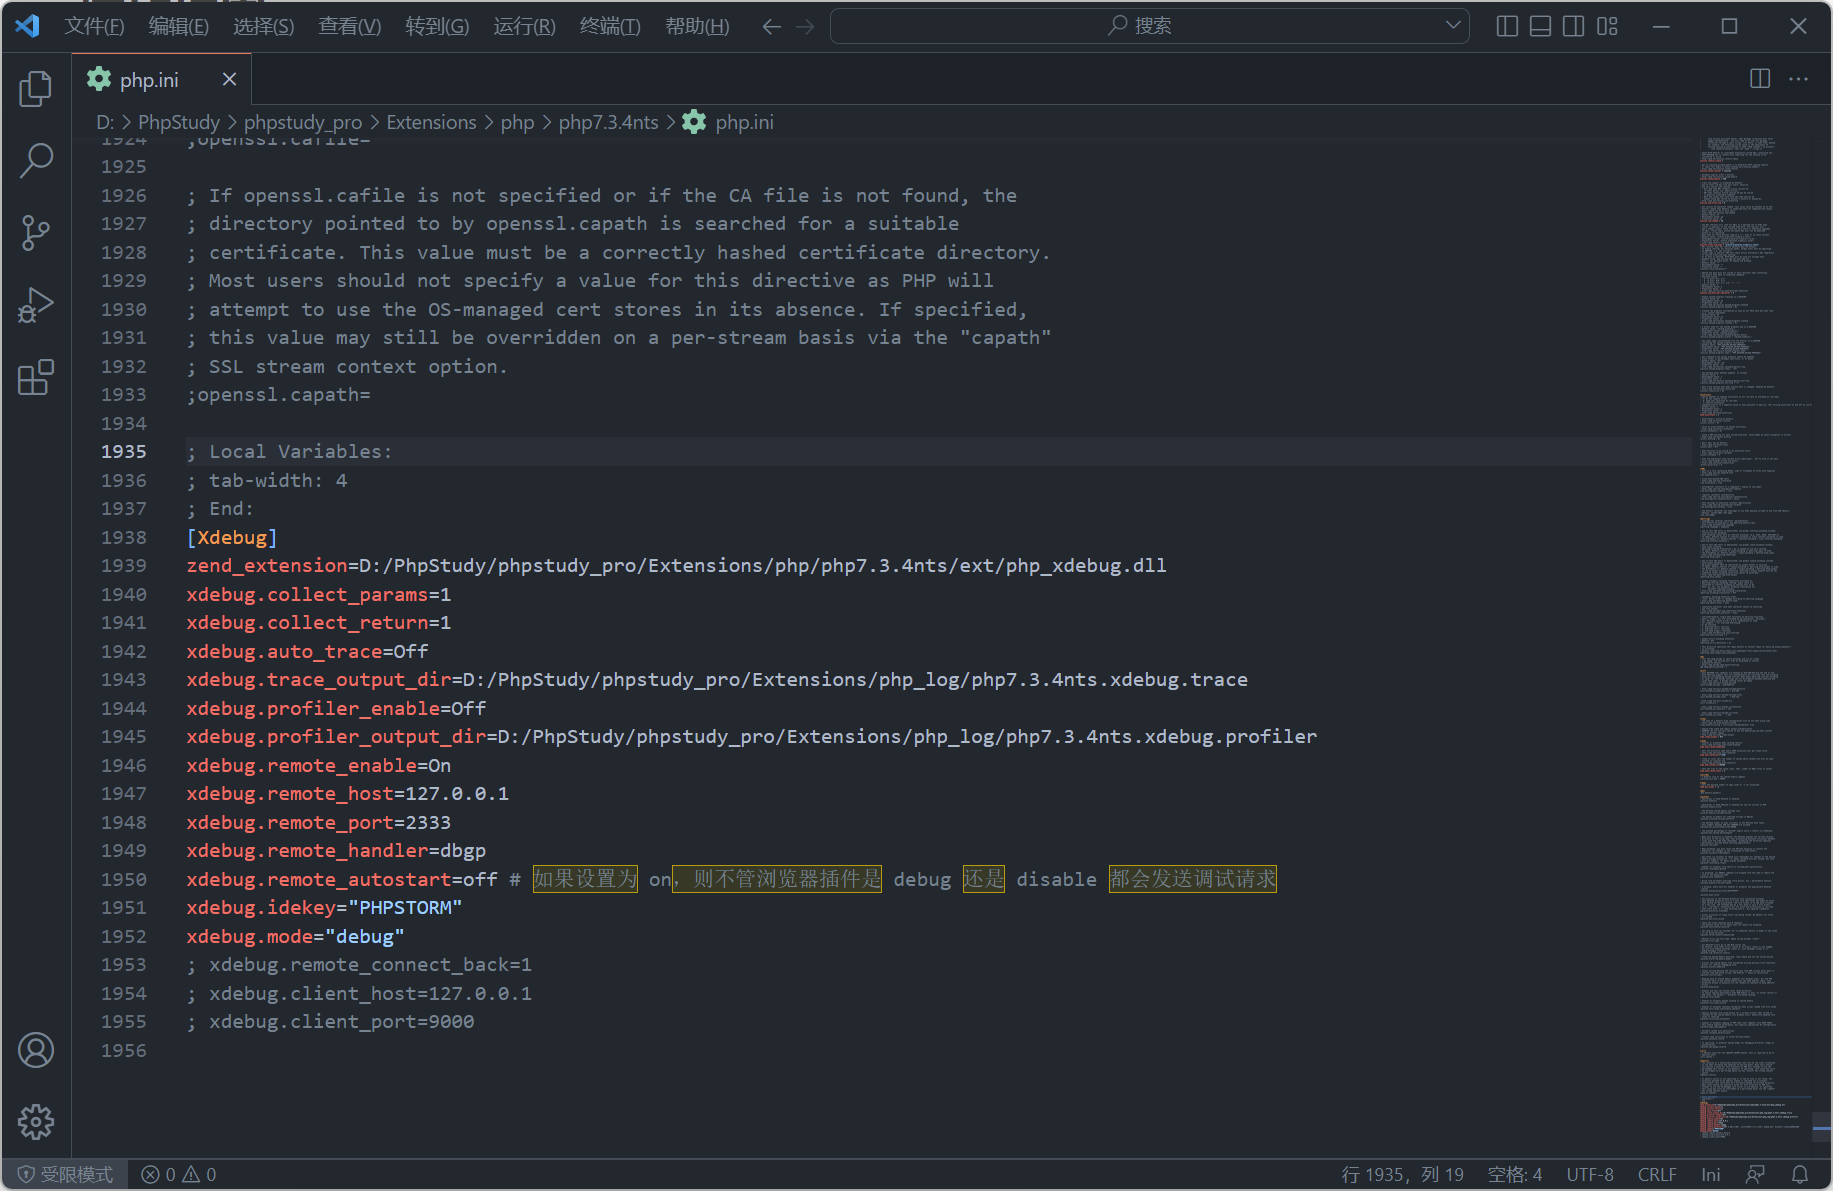
php.ini
[Xdebug]
zend_extension=D:/PhpStudy/phpstudy_pro/Extensions/php/php7.3.4nts/ext/php_xdebug.dll
xdebug.collect_params=1
xdebug.collect_return=1
xdebug.auto_trace=Off
xdebug.trace_output_dir=D:/PhpStudy/phpstudy_pro/Extensions/php_log/php7.3.4nts.xdebug.trace
xdebug.profiler_enable=Off
xdebug.profiler_output_dir=D:/PhpStudy/phpstudy_pro/Extensions/php_log/php7.3.4nts.xdebug.profiler
xdebug.remote_enable=On
xdebug.remote_host=127.0.0.1
xdebug.remote_port=2333
xdebug.remote_handler=dbgp
xdebug.remote_autostart=off # 如果设置为 on,则不管浏览器插件是 debug 还是 disable 都会发送调试请求
xdebug.idekey="PHPSTORM"
xdebug.mode="debug"
; xdebug.remote_connect_back=1
; xdebug.client_host=127.0.0.1
; xdebug.client_port=9000
xdebug 插件下载:
https://xdebug.org/wizard
将输出的 phpinfo() 信息复制到里面,判断适合的版本信息:
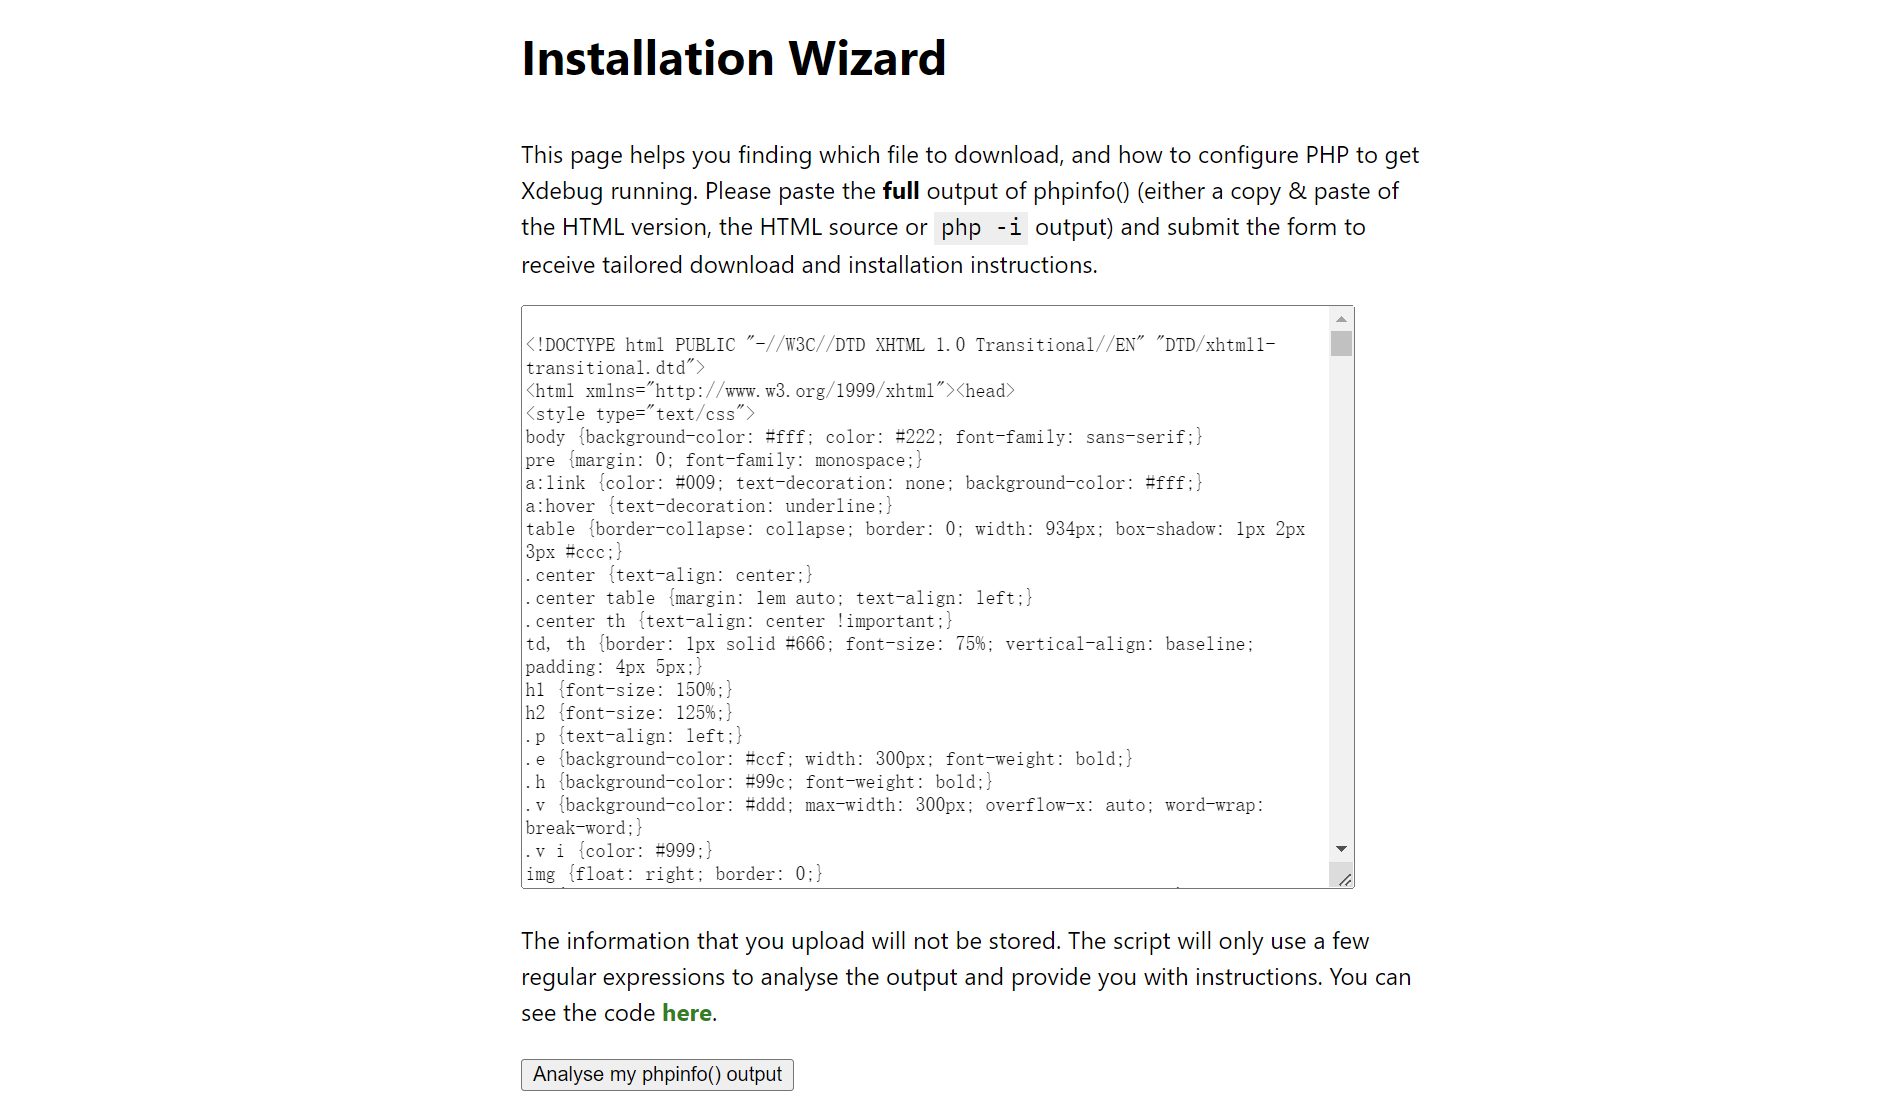
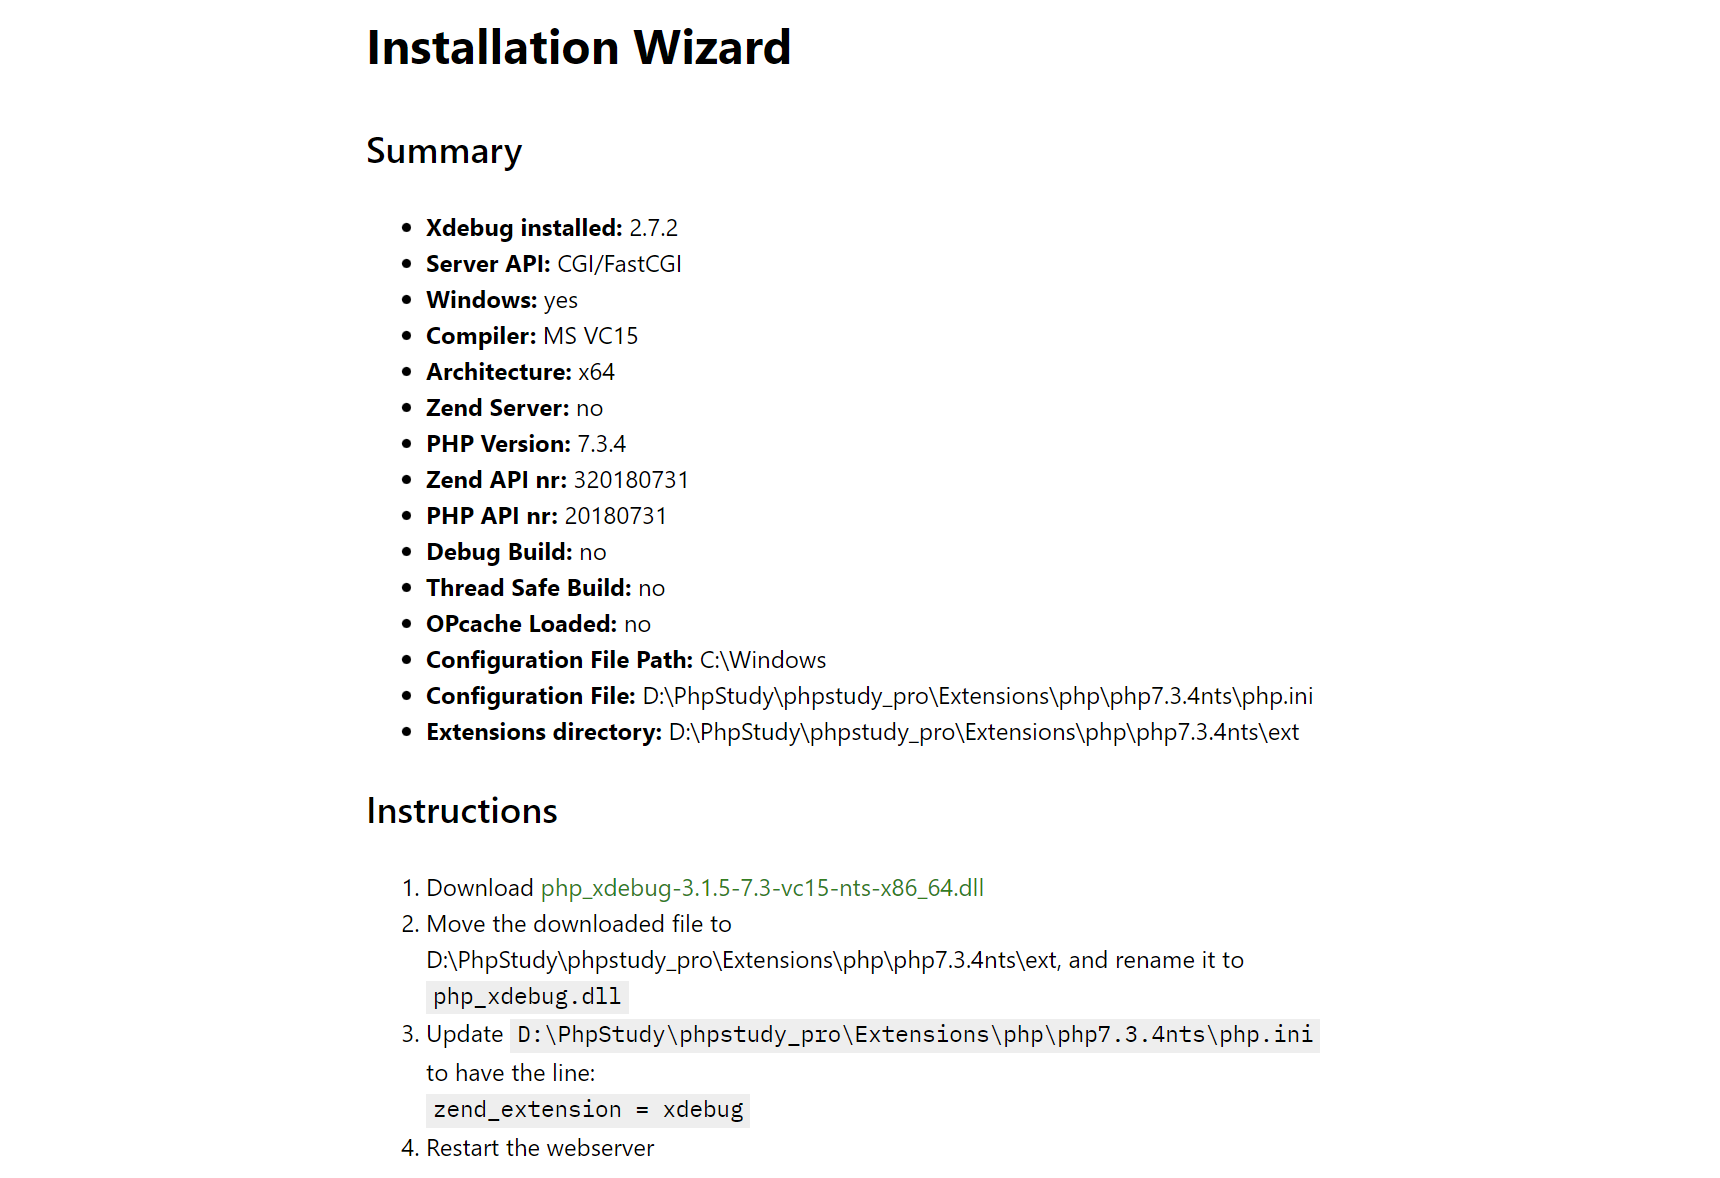
按照指引配置,或者直接使用 PhpStudy 里面的配置即可。
提示
PhpStudy 中自带了 xdebug,可直接使用。
- PHPStorm 配置
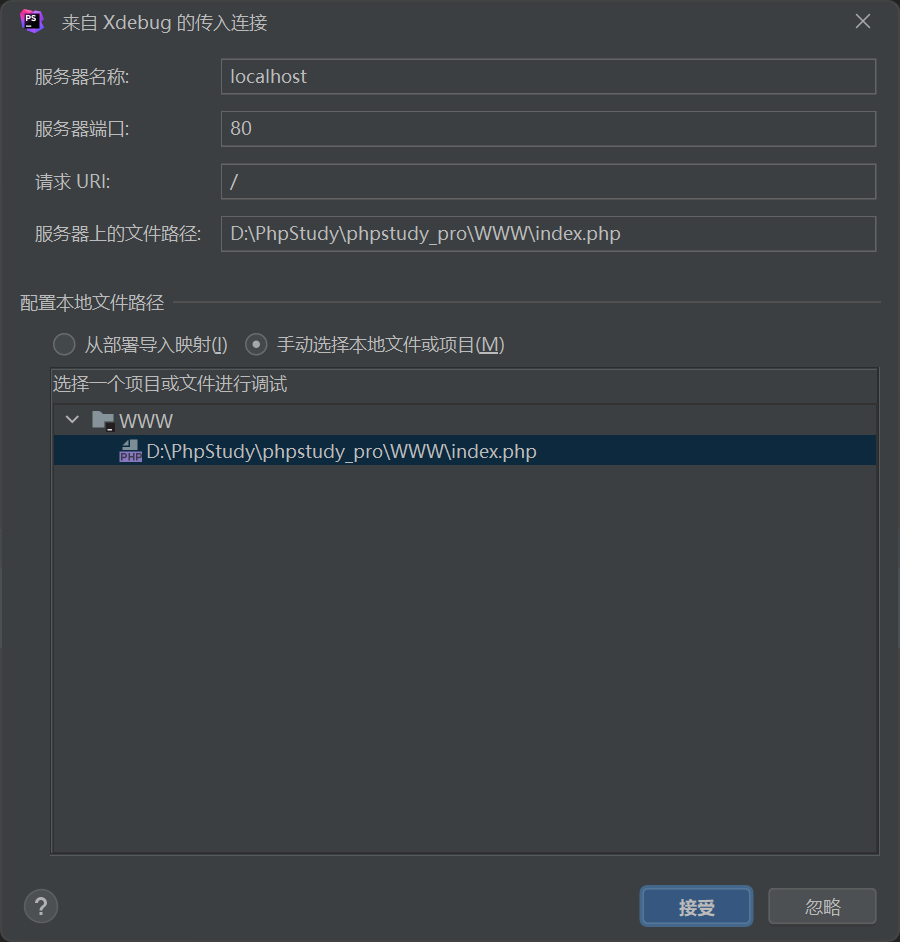
创建一个服务器:
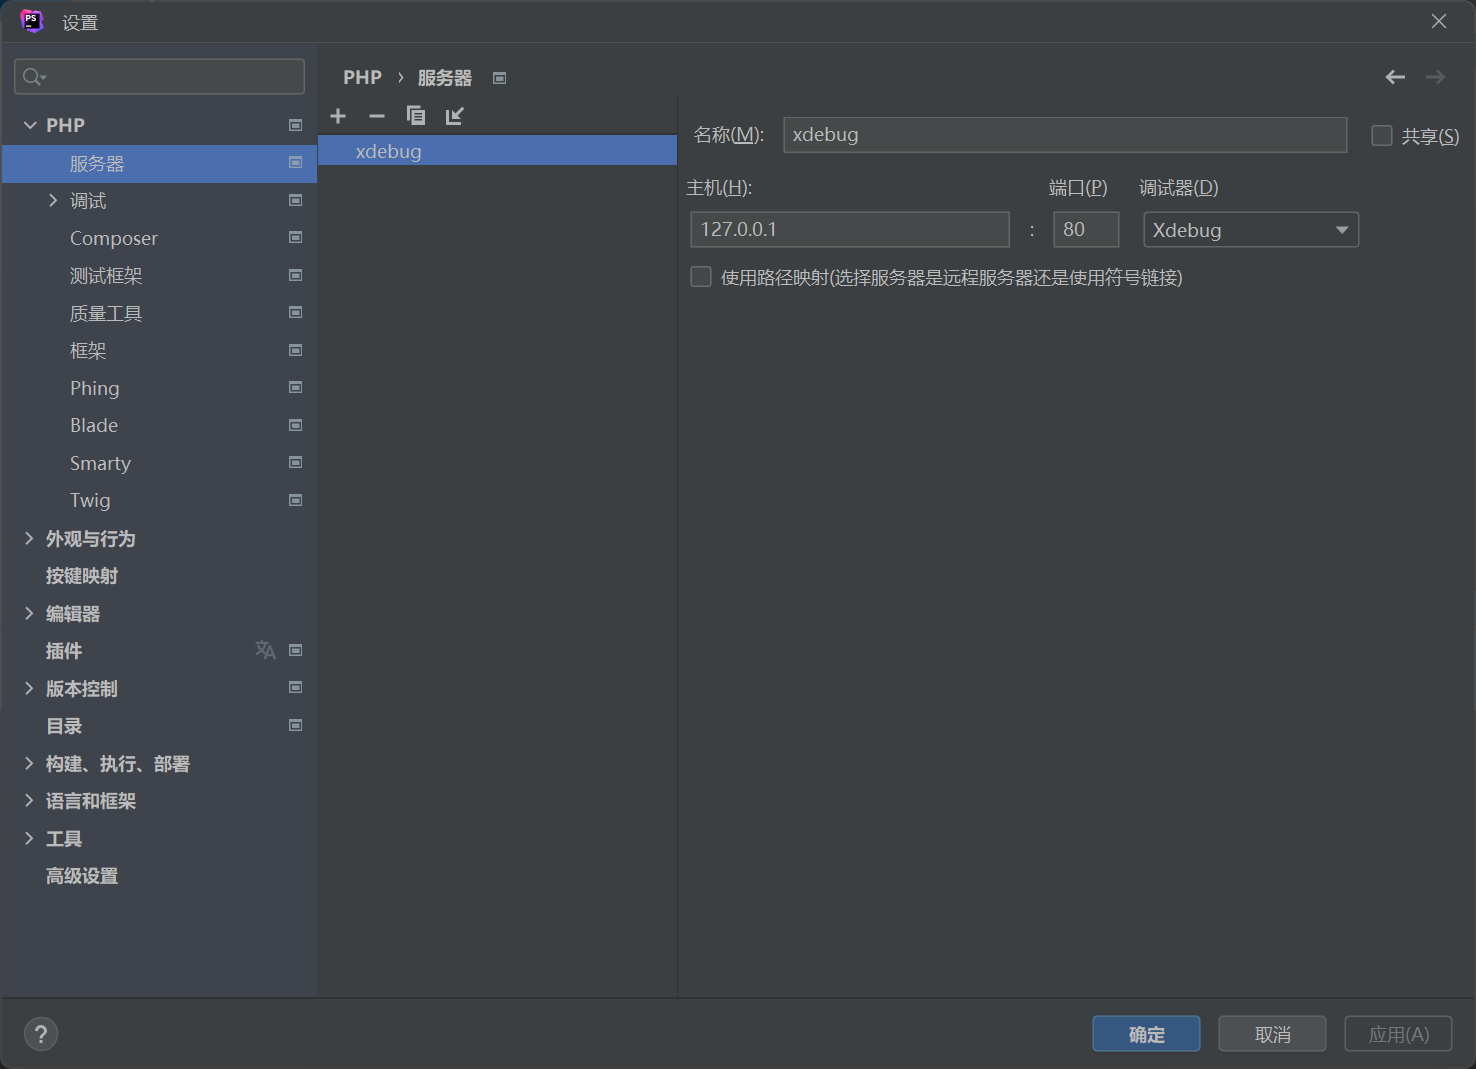
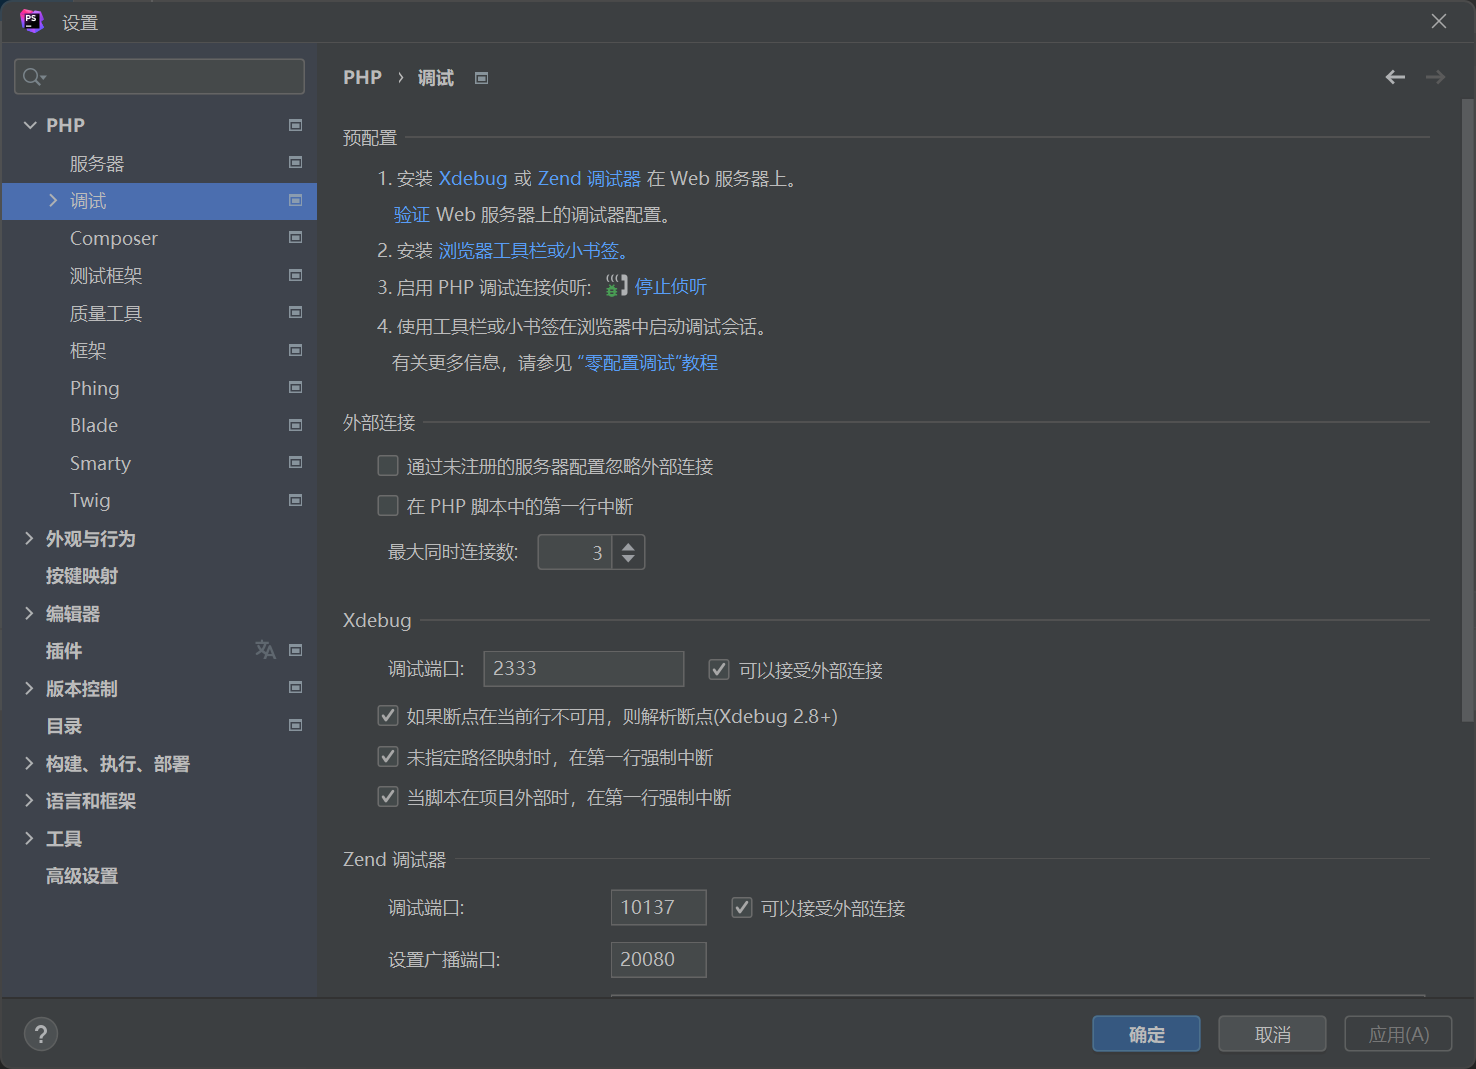
修改调试端口,注意调试端口要和 php.ini 中的 xdebug.remote_port=2333 端口相同。
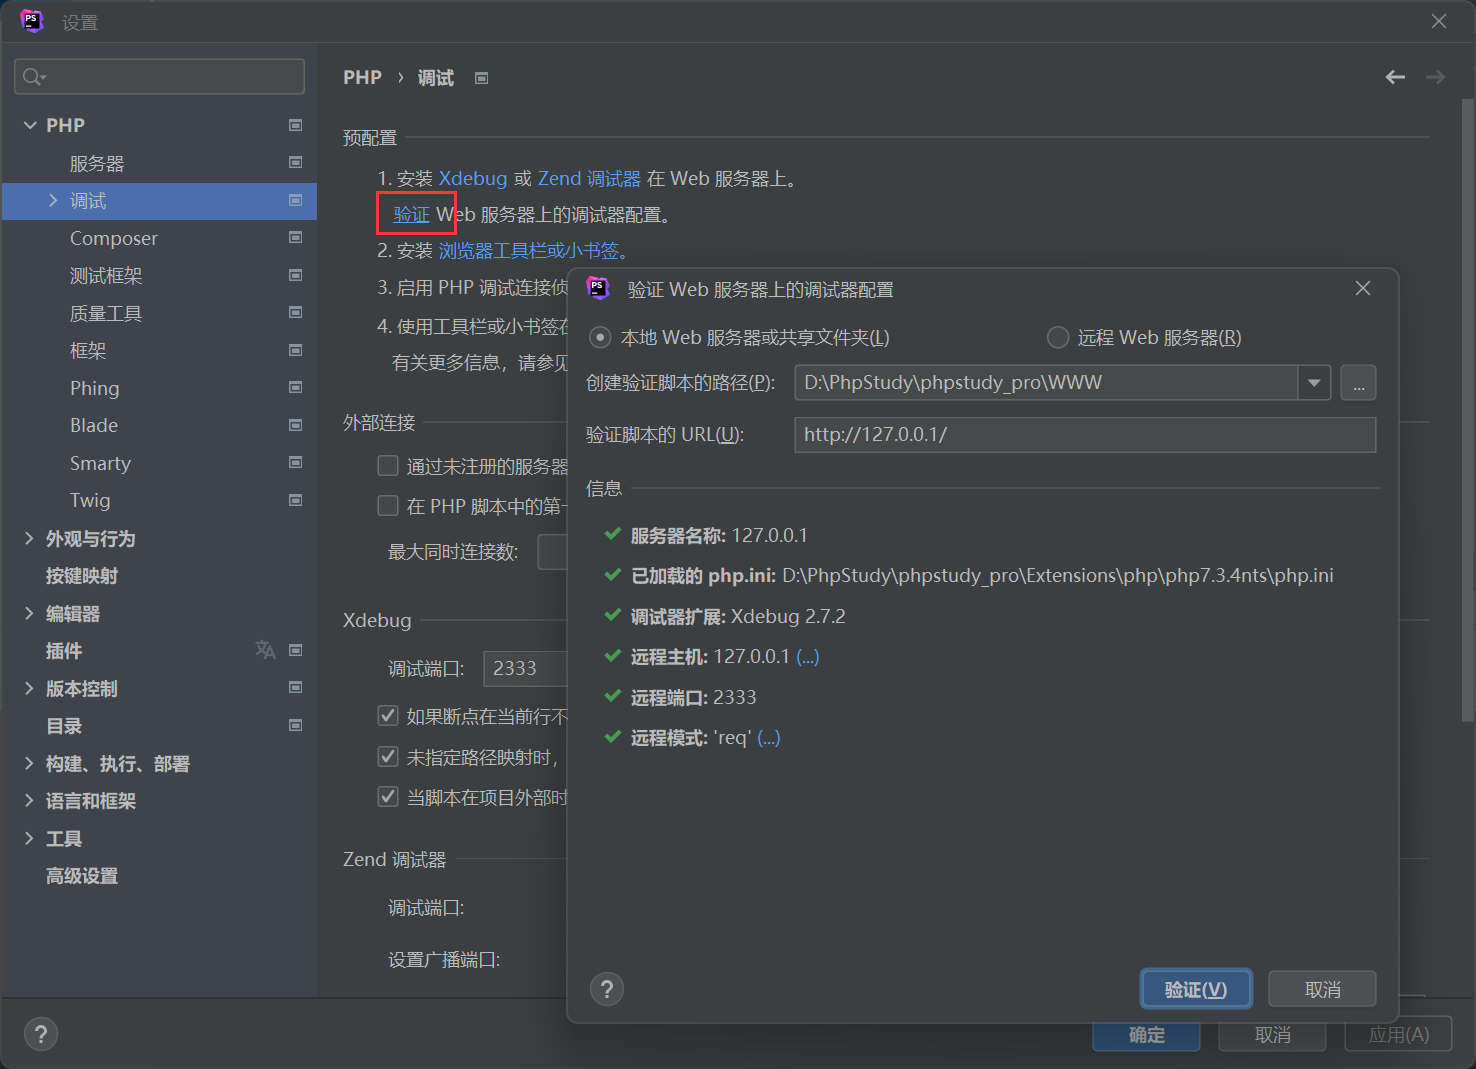
验证配置:
设置 DBGp 代理:
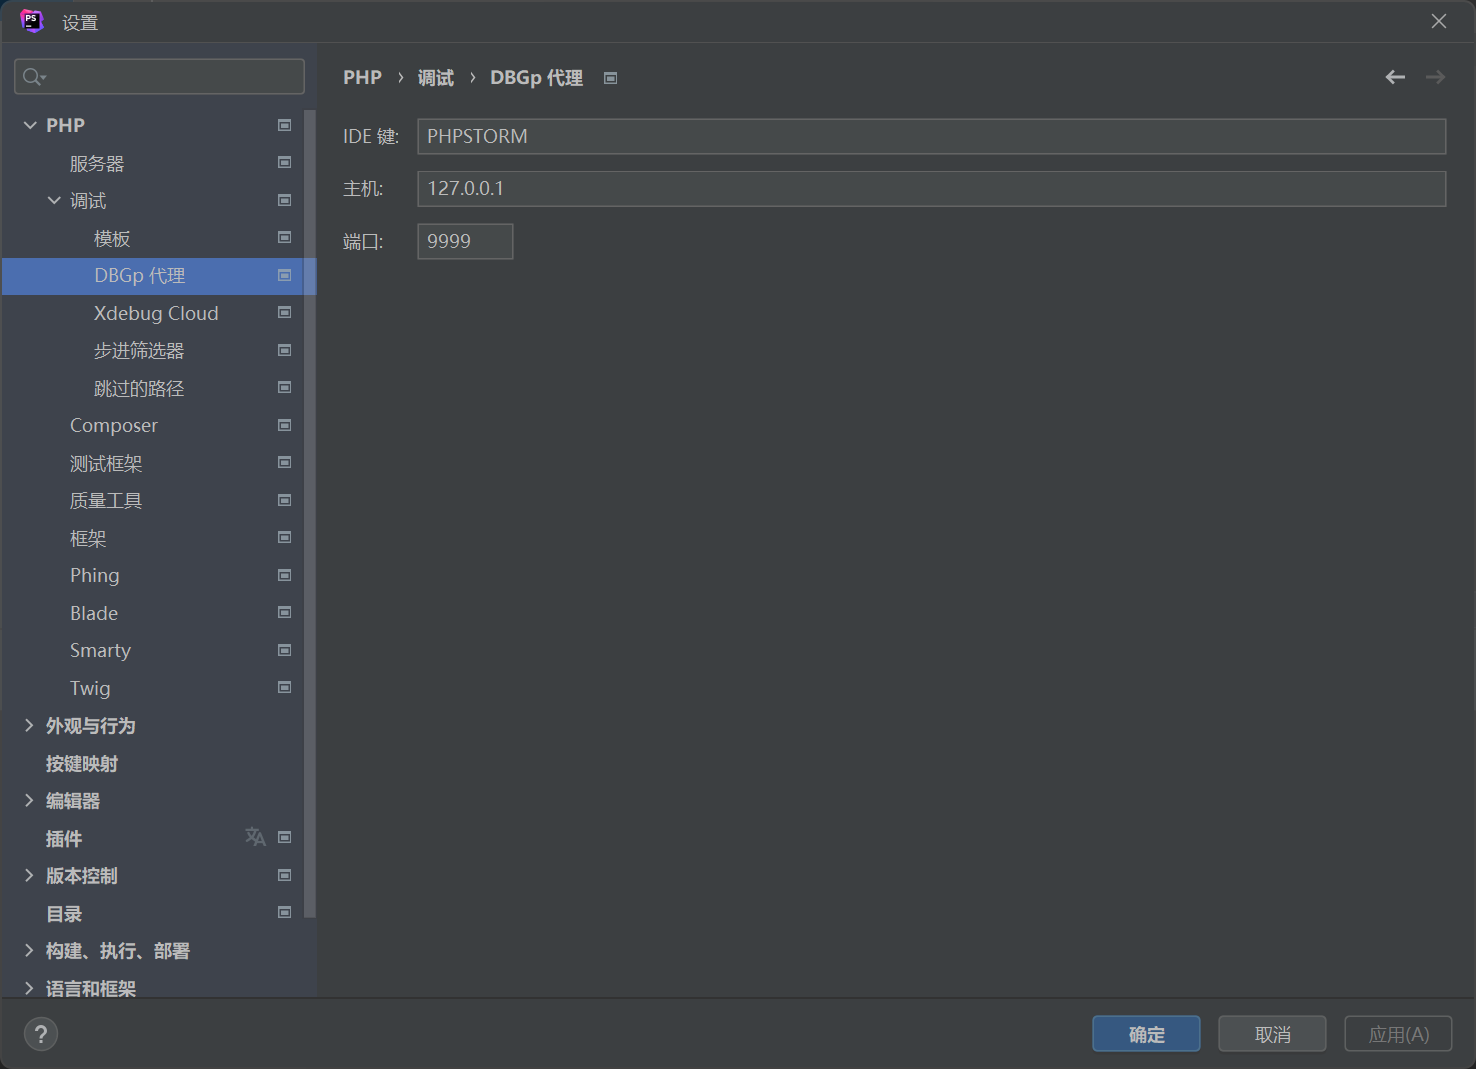
端口可以任意选择,只要不冲突。
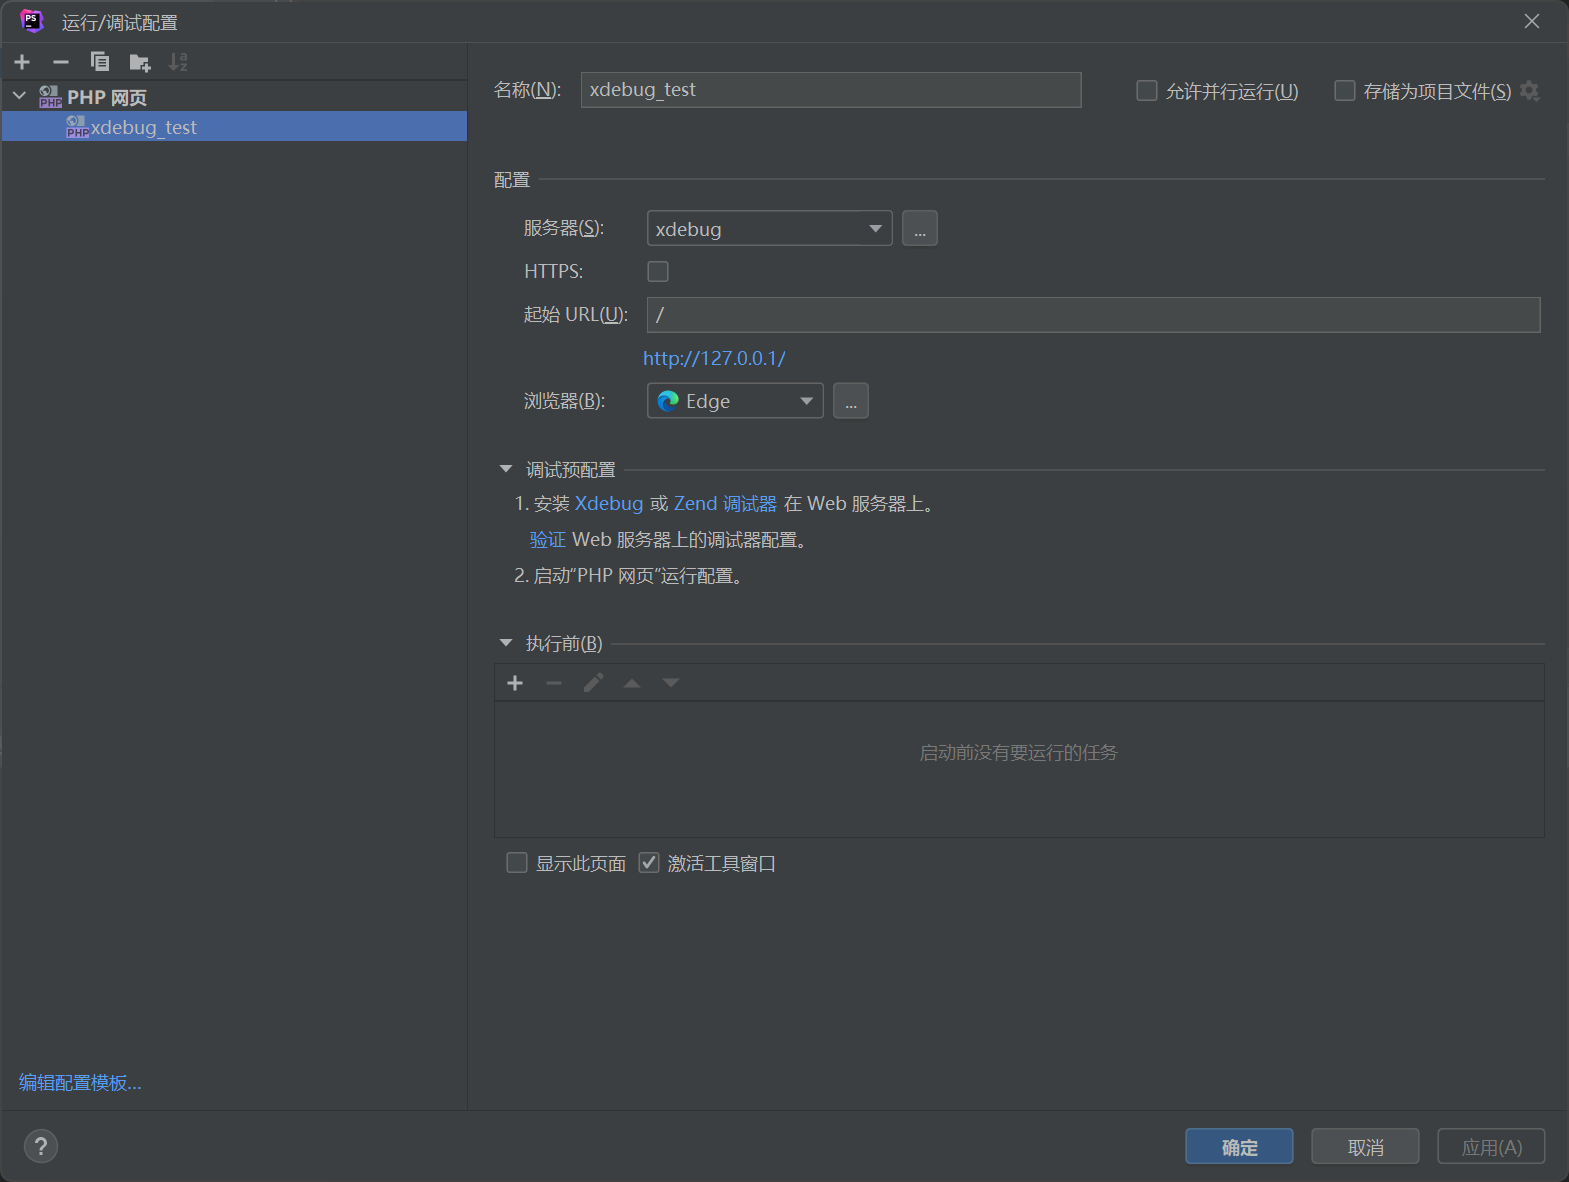
运行调试配置:
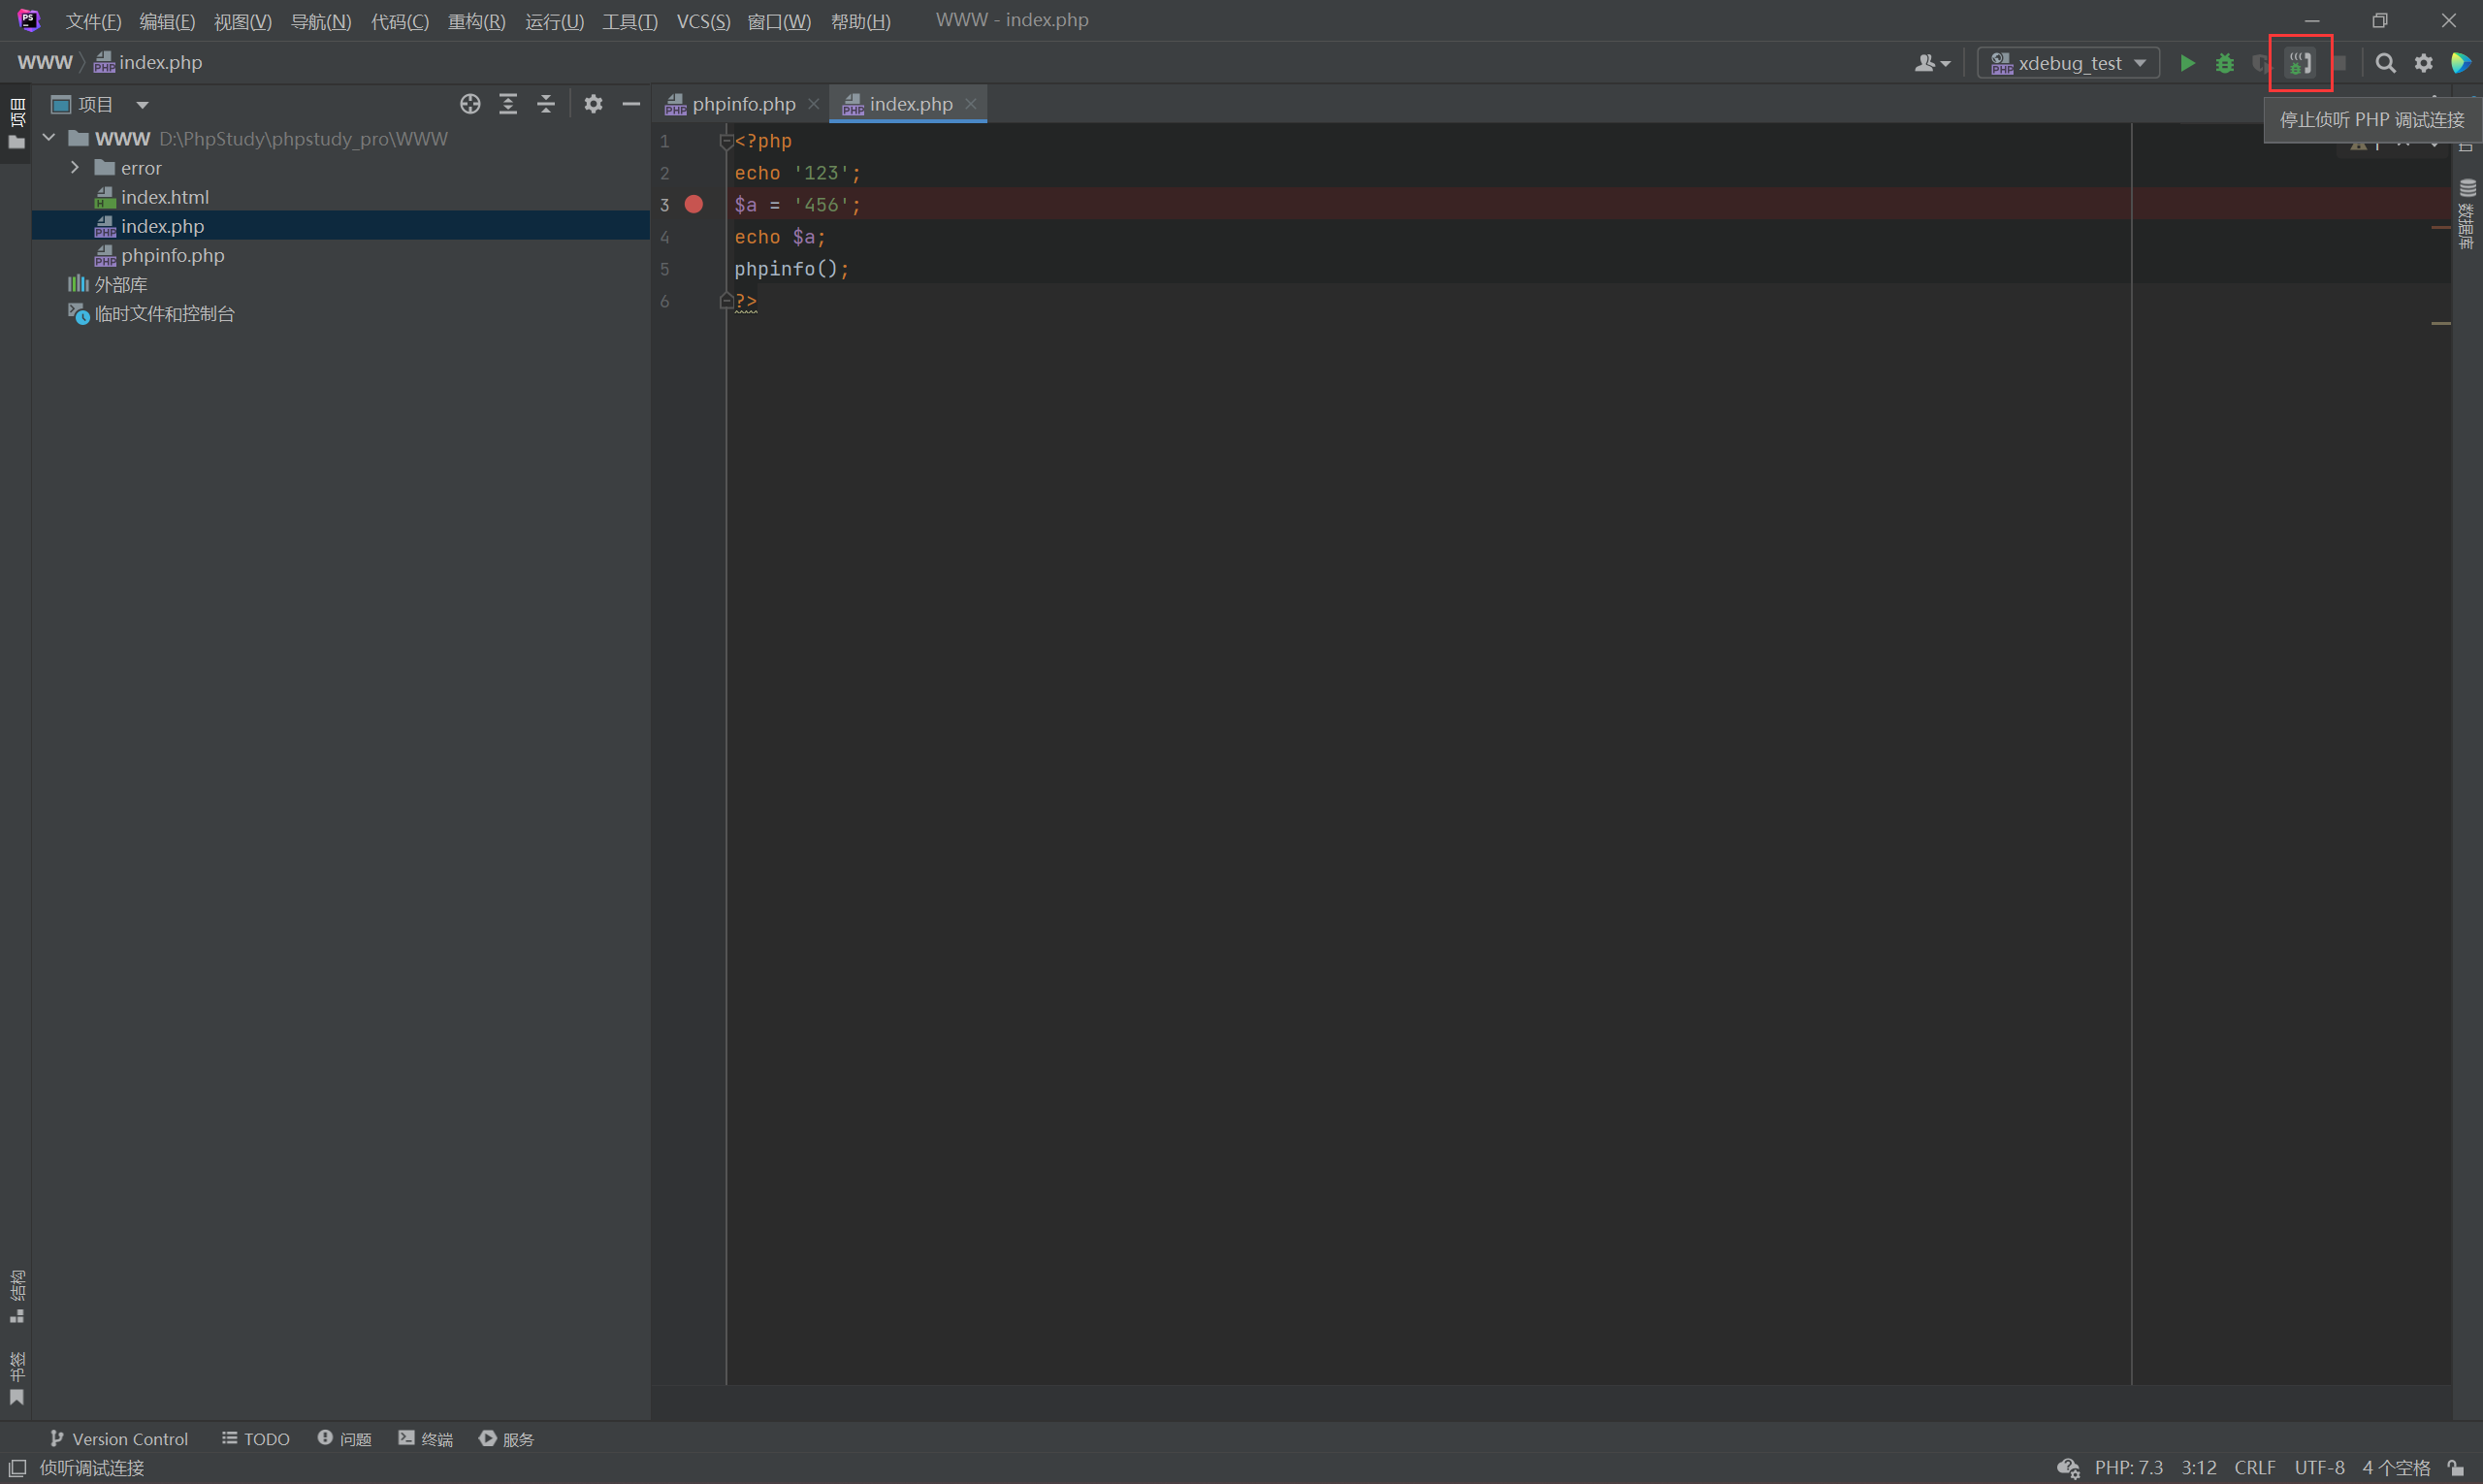
开启监听:
启动调试按钮:
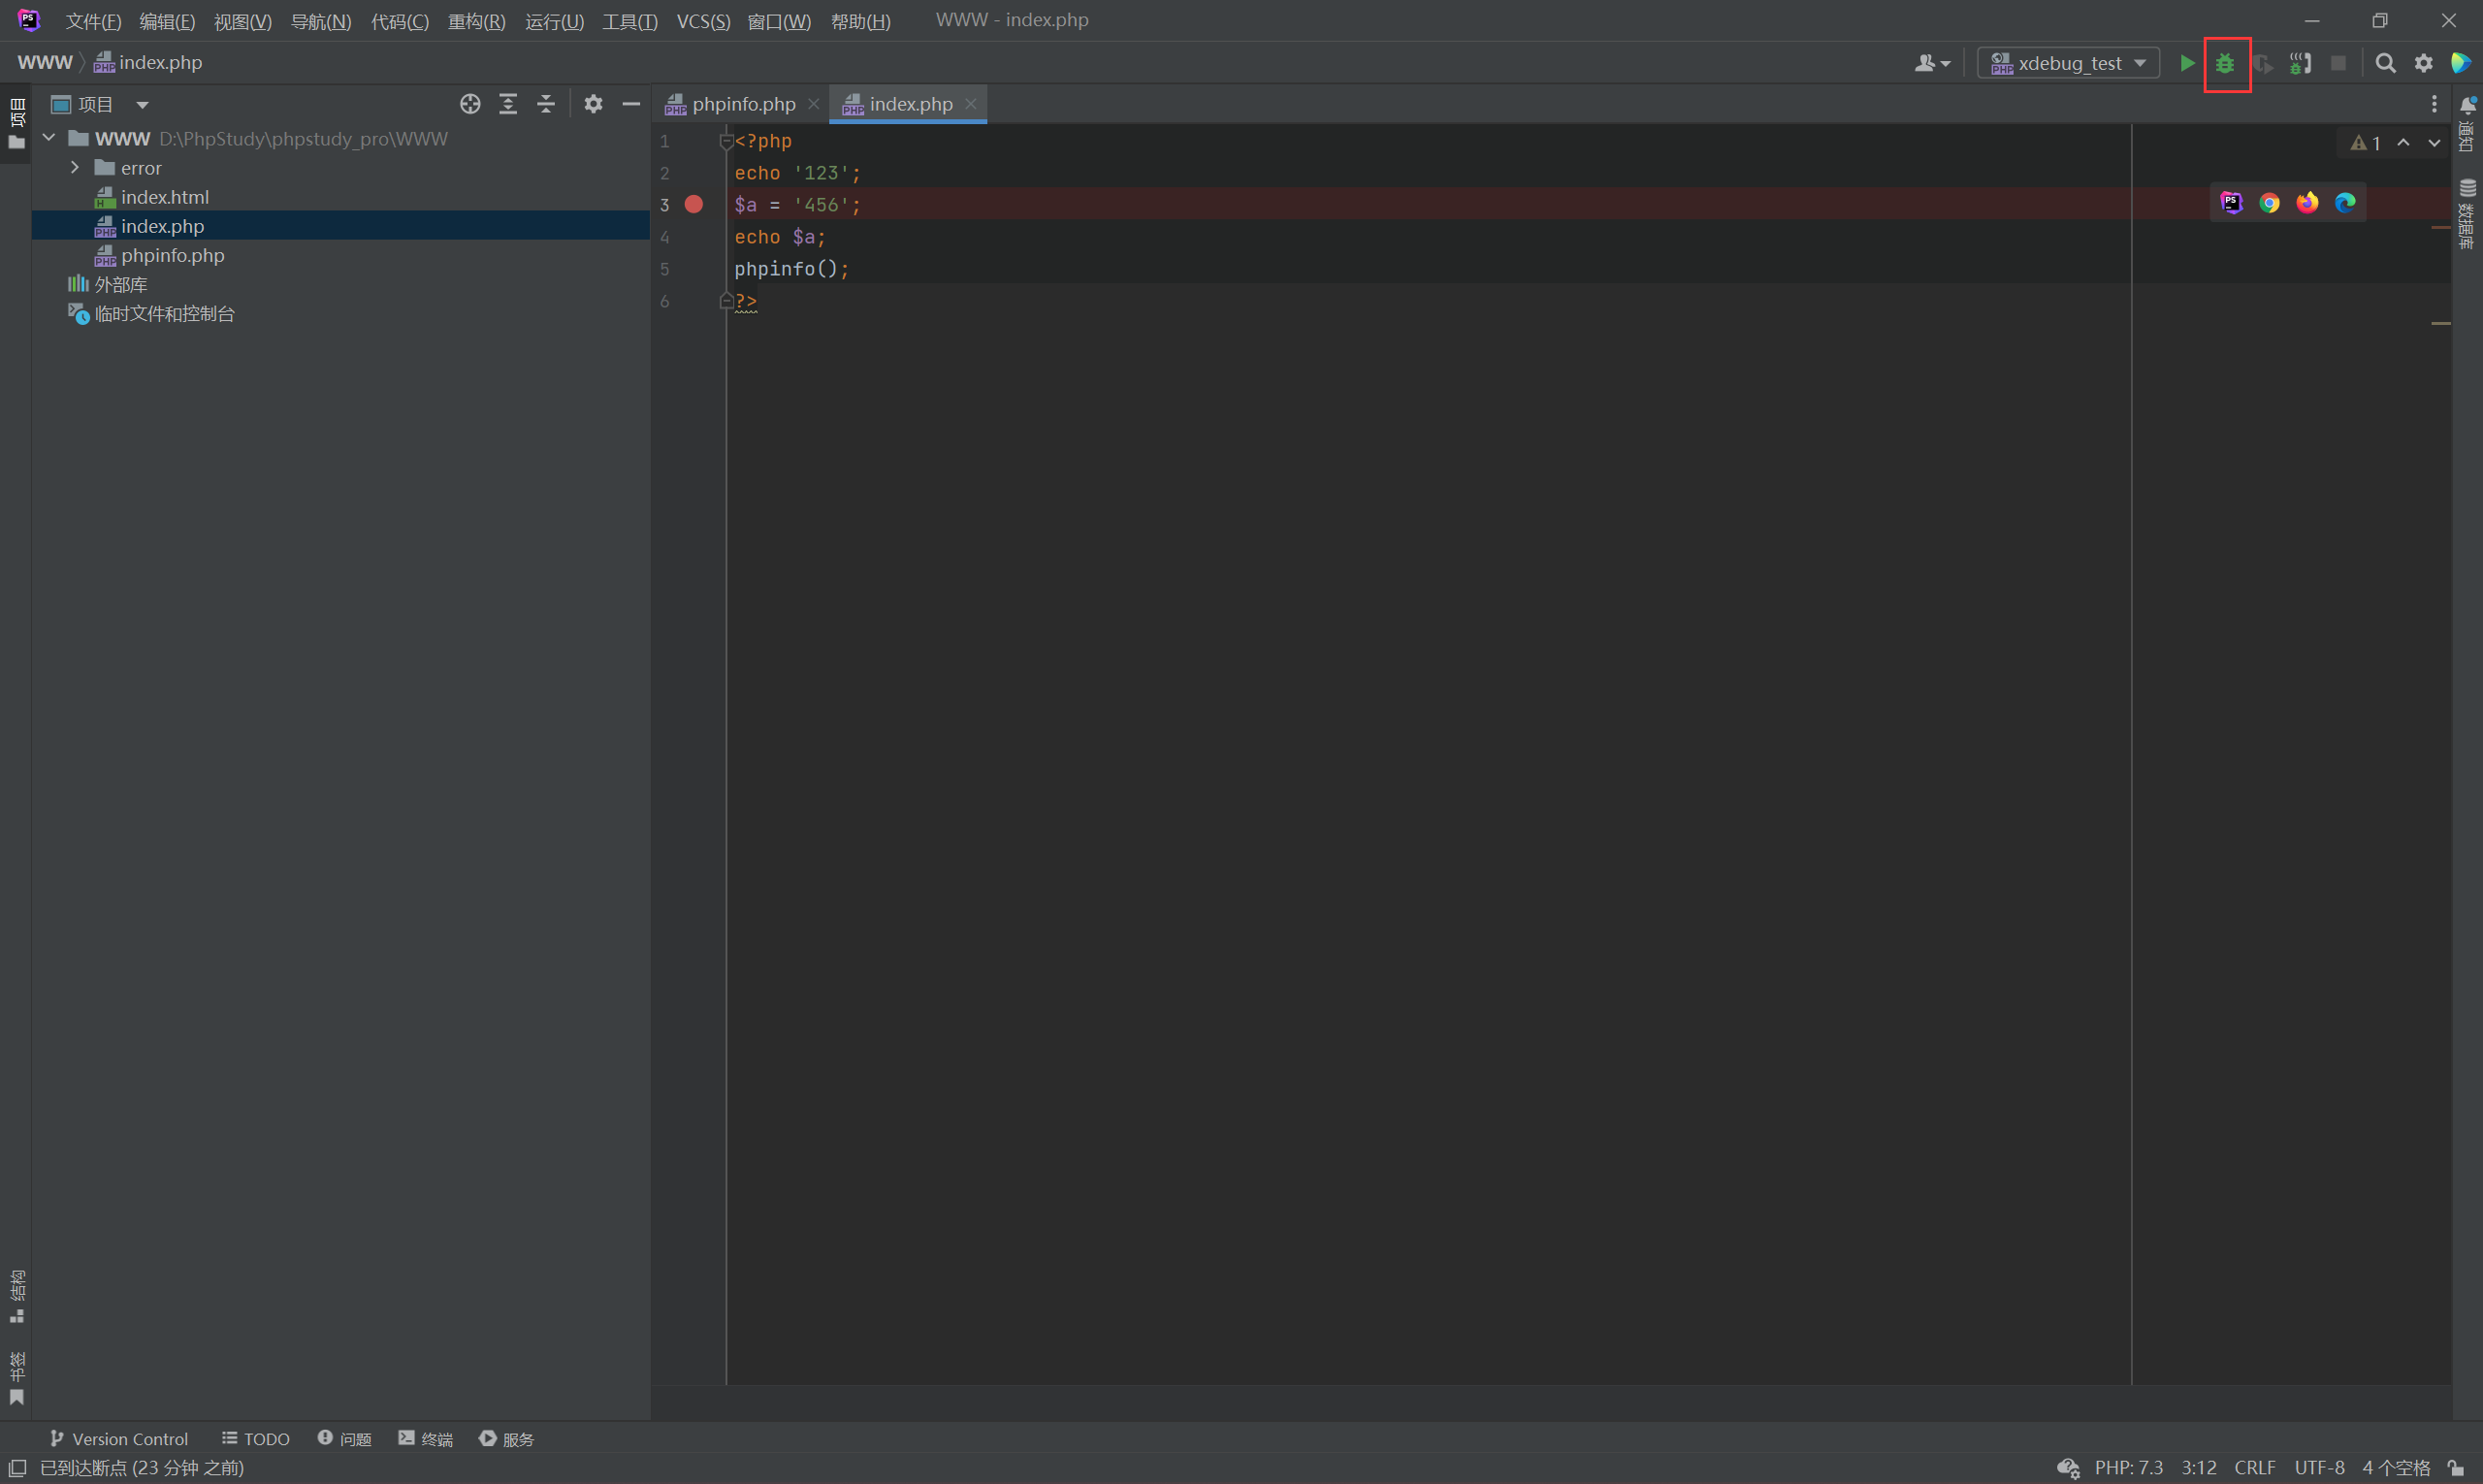
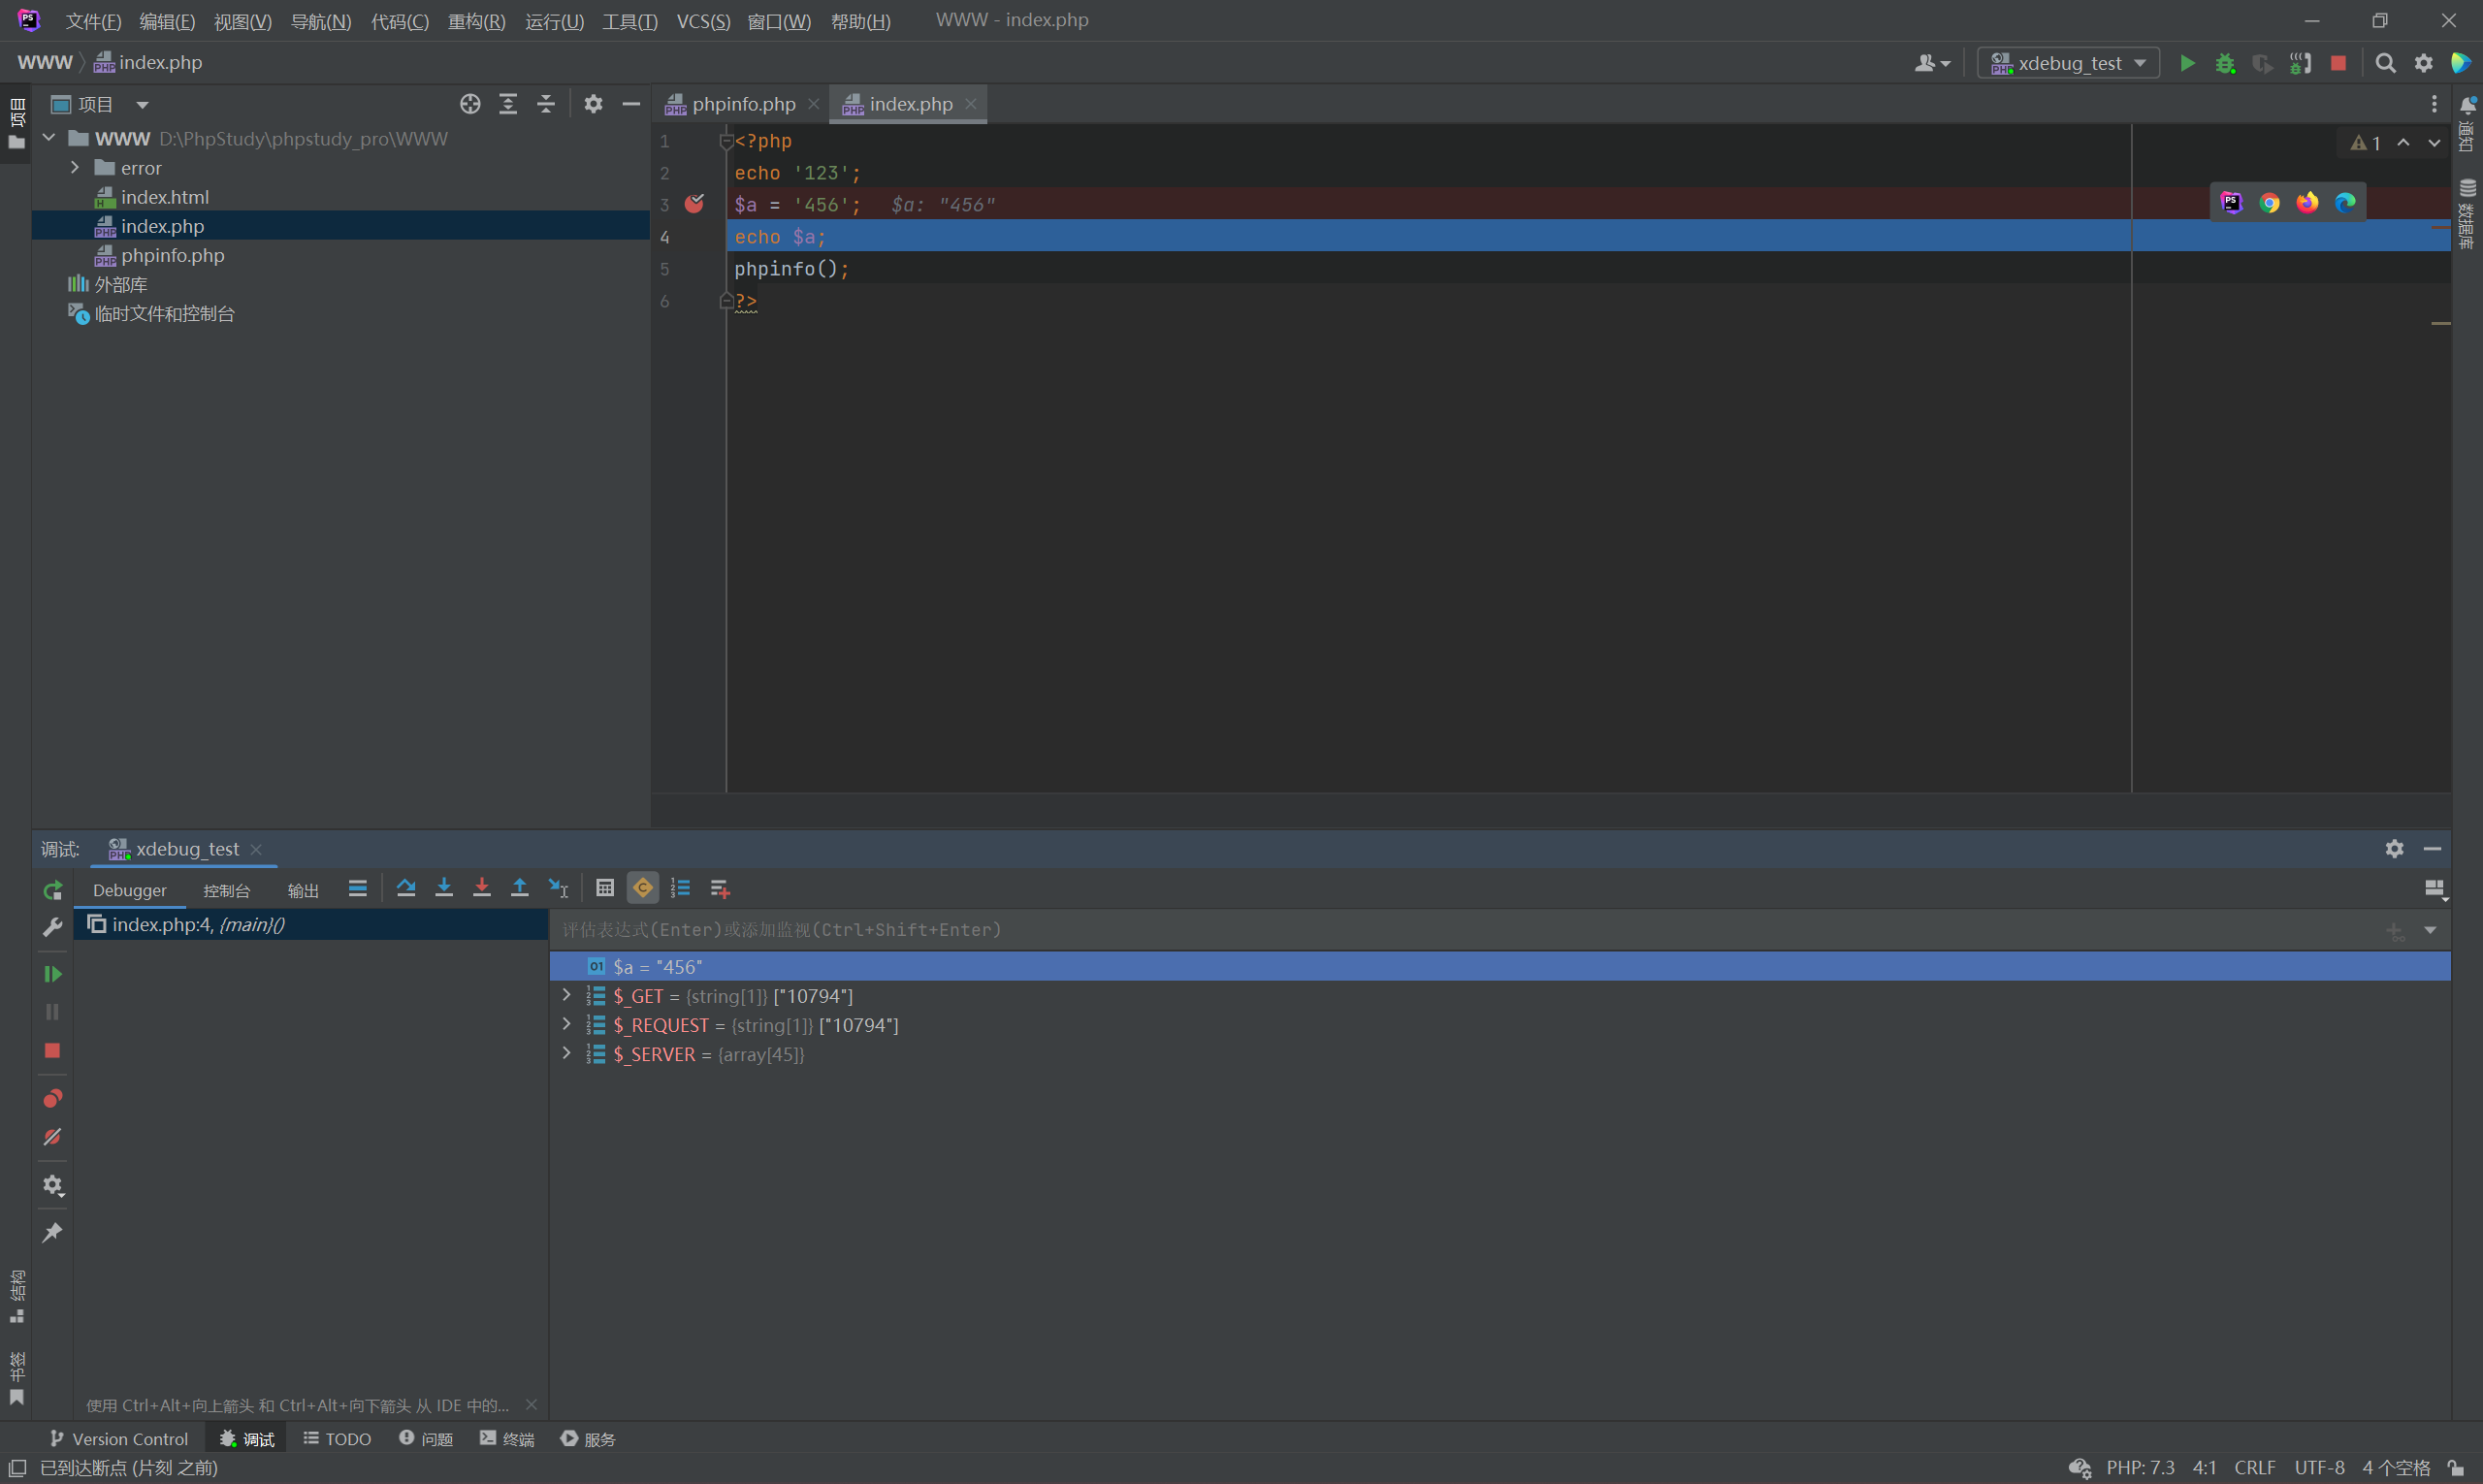
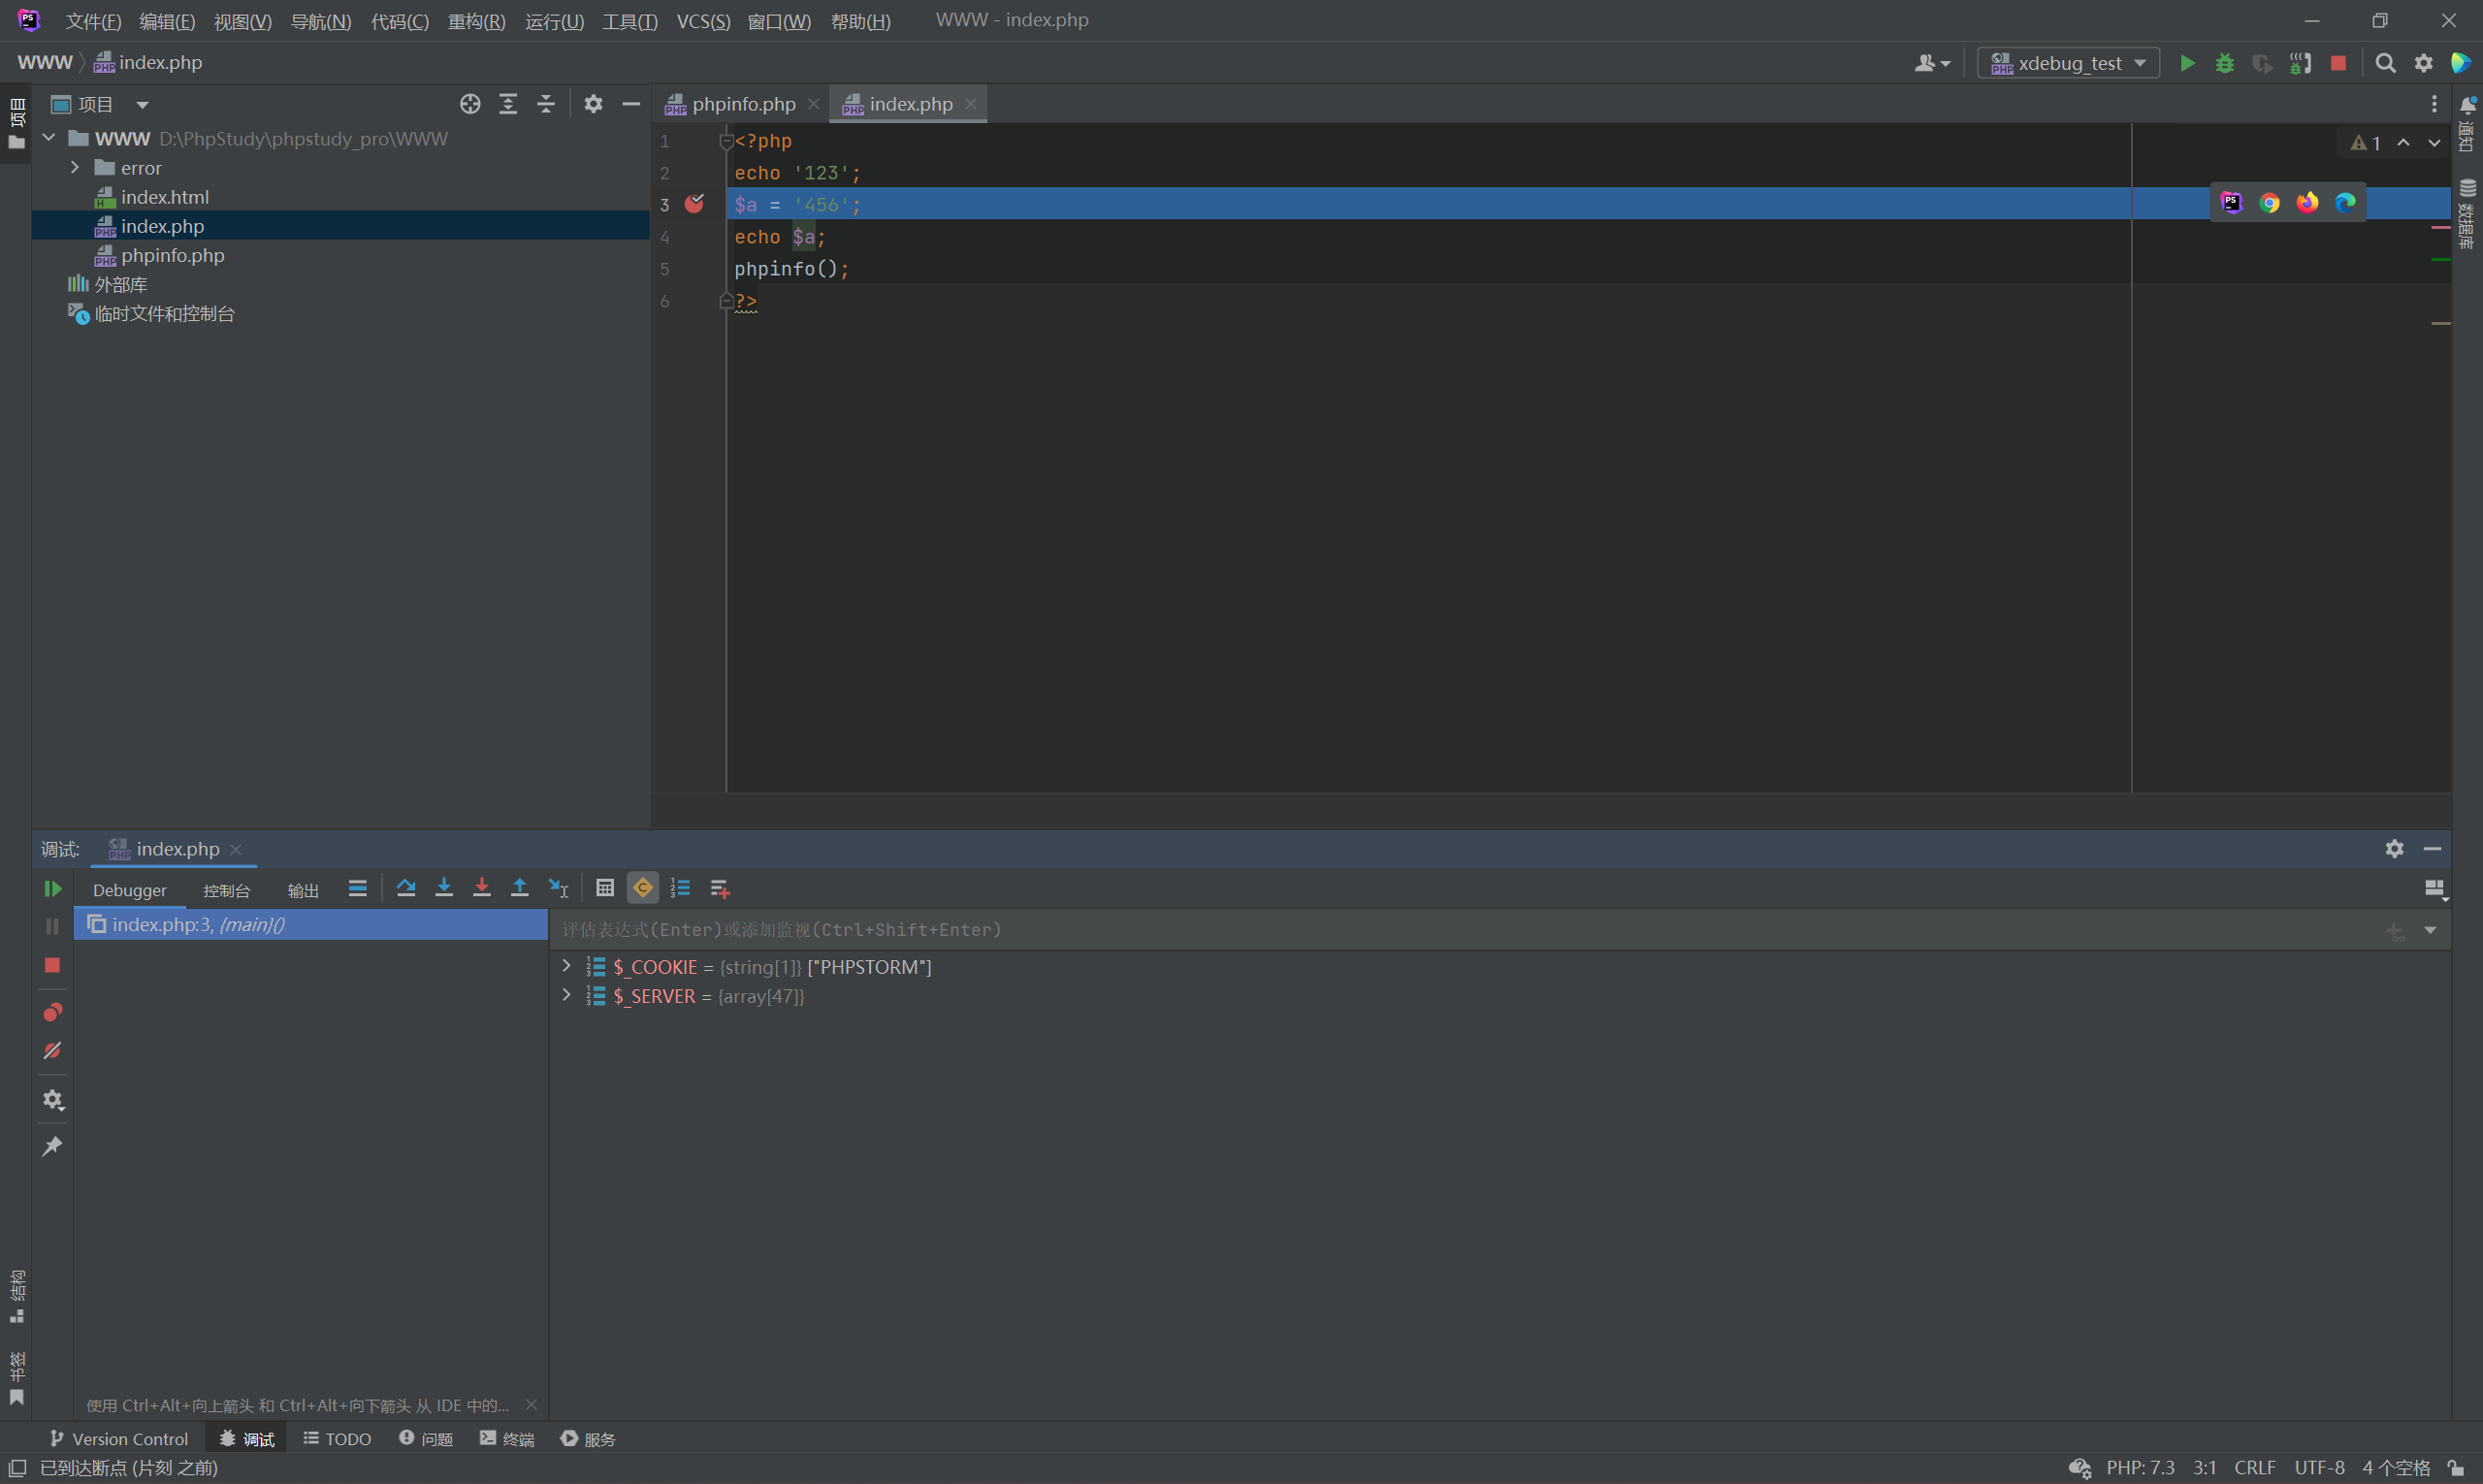
可以看到变量的调试信息:
- 使用 xdebug helper 插件
直接打开浏览器,选择 xdebug 模式,访问需要调试的主机:
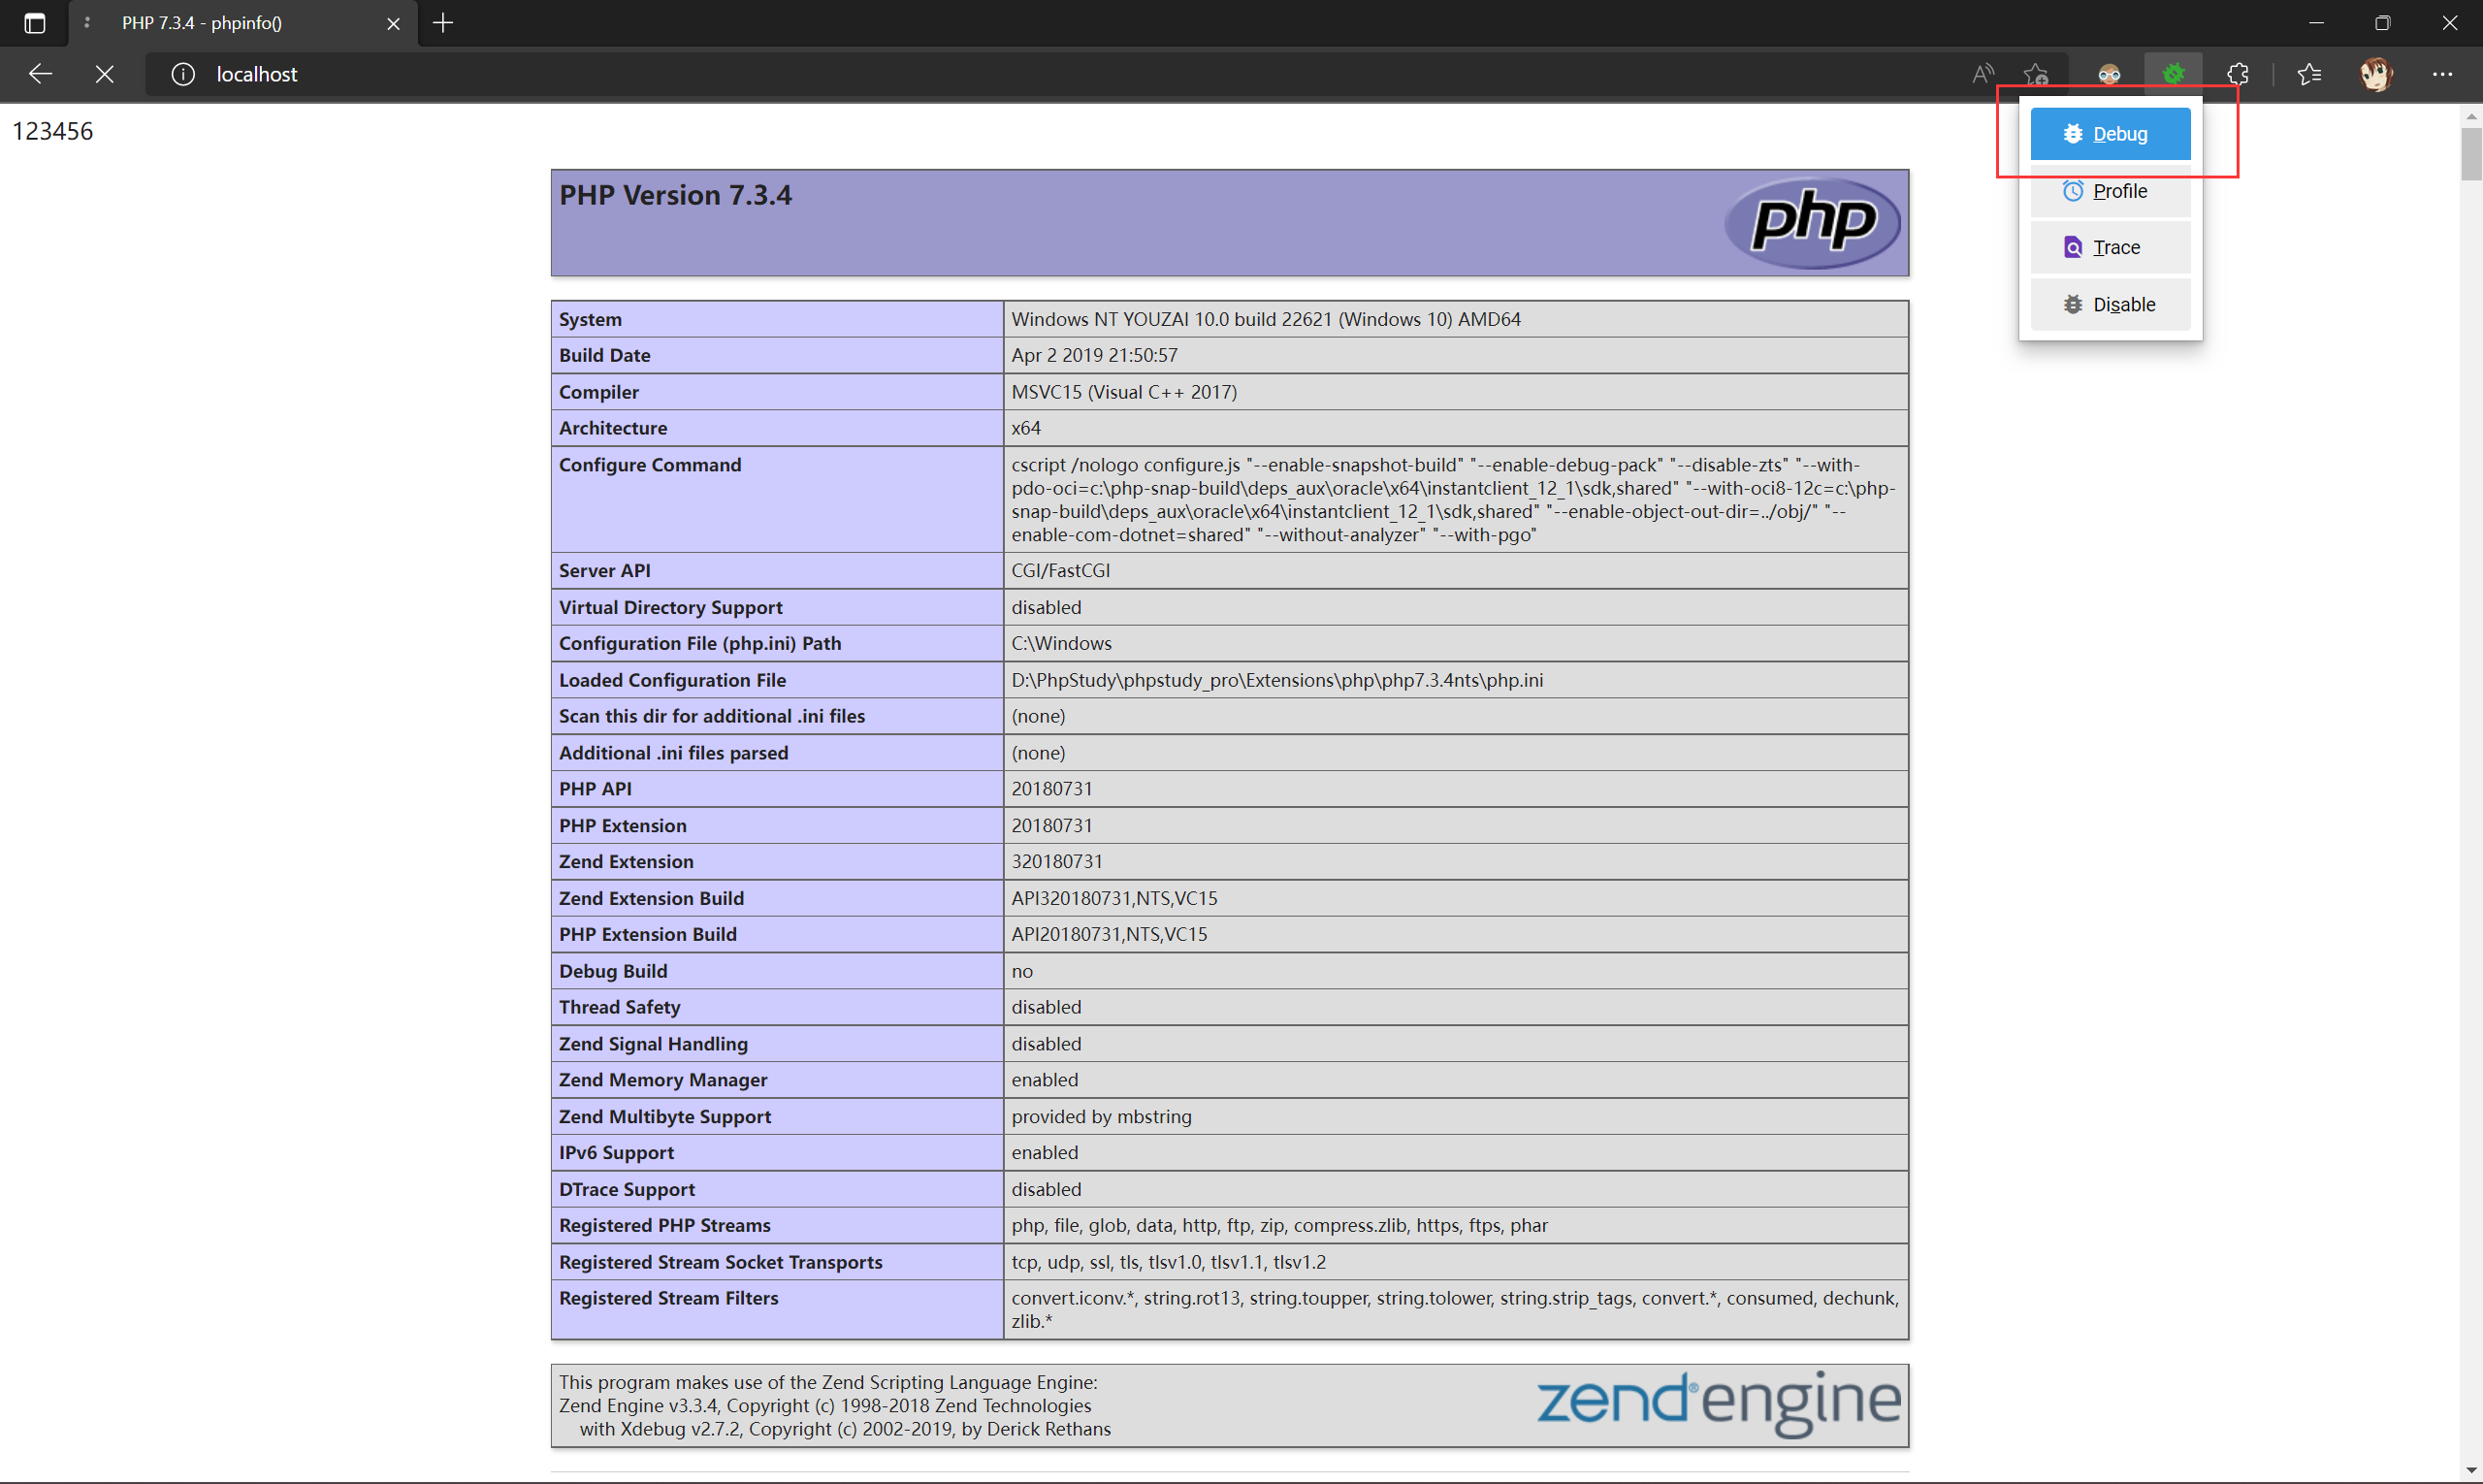
选择 debug 后浏览器会将请求发送到 PHPStorm 中:
选择调试即可。
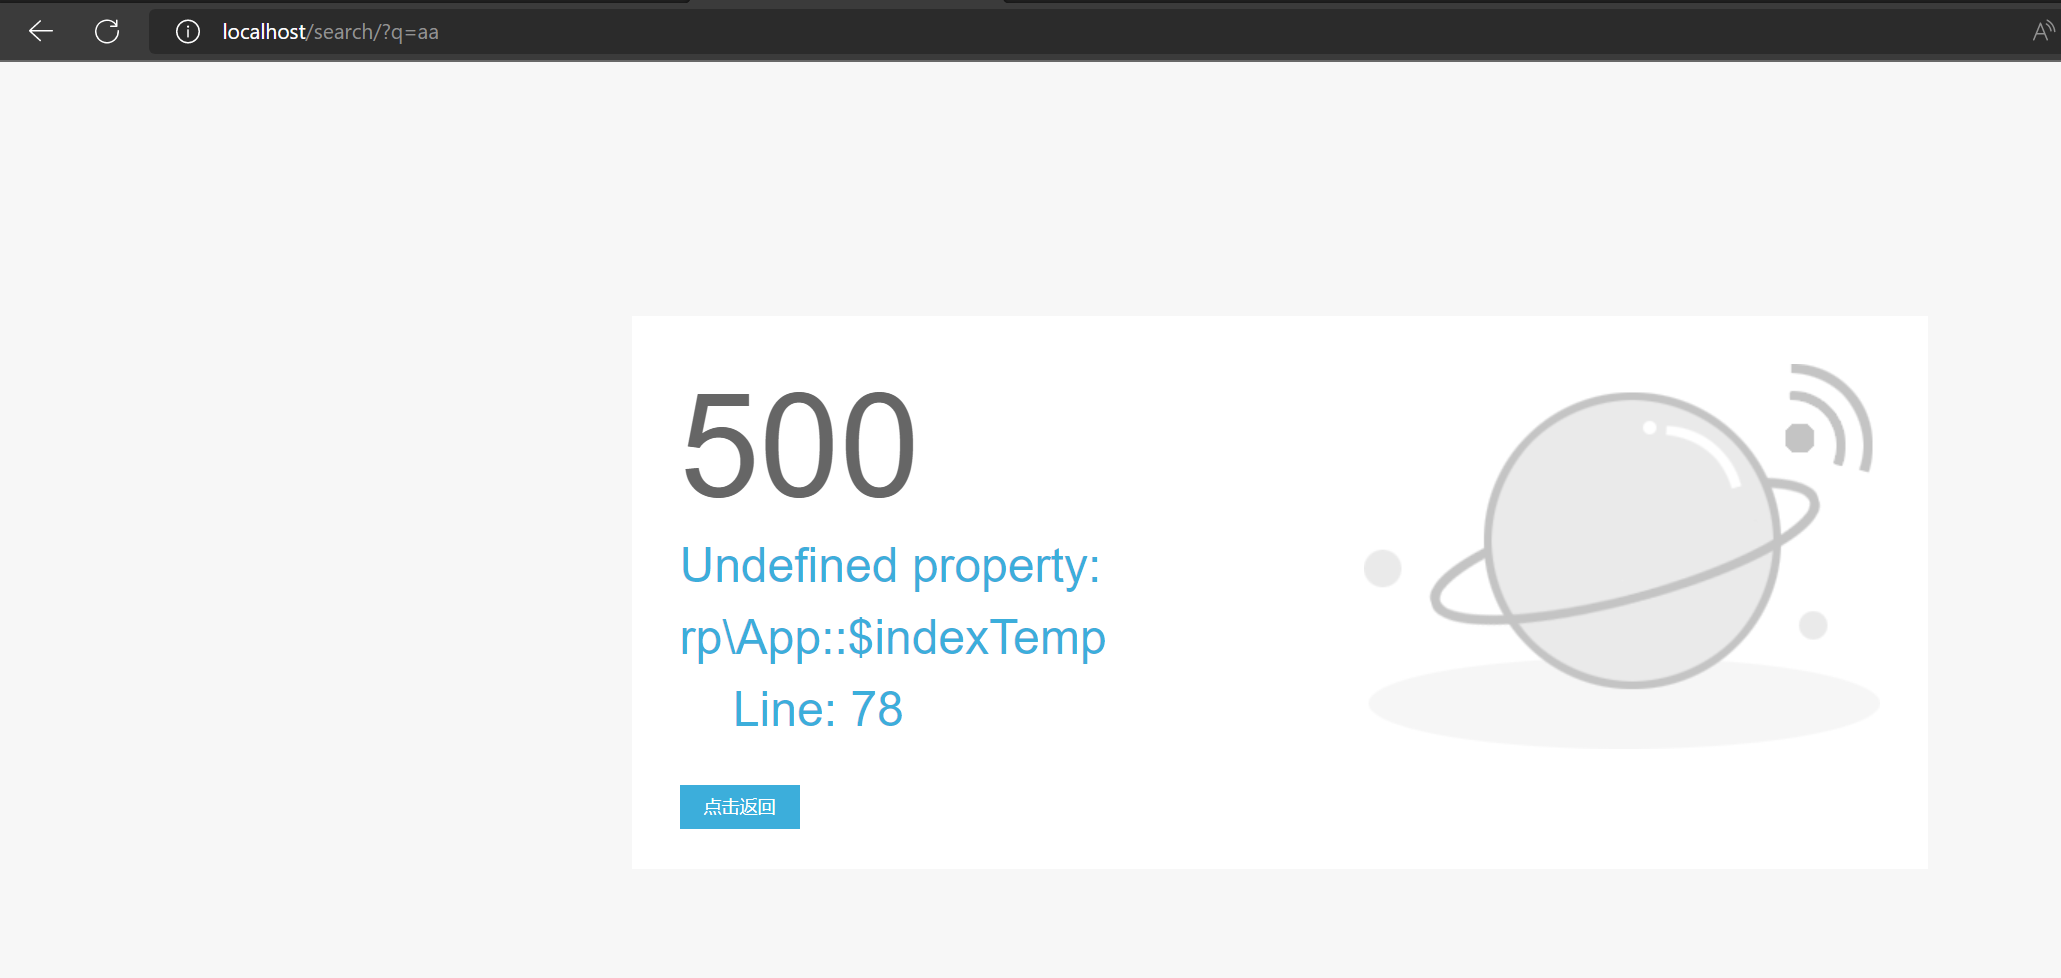
错误提示
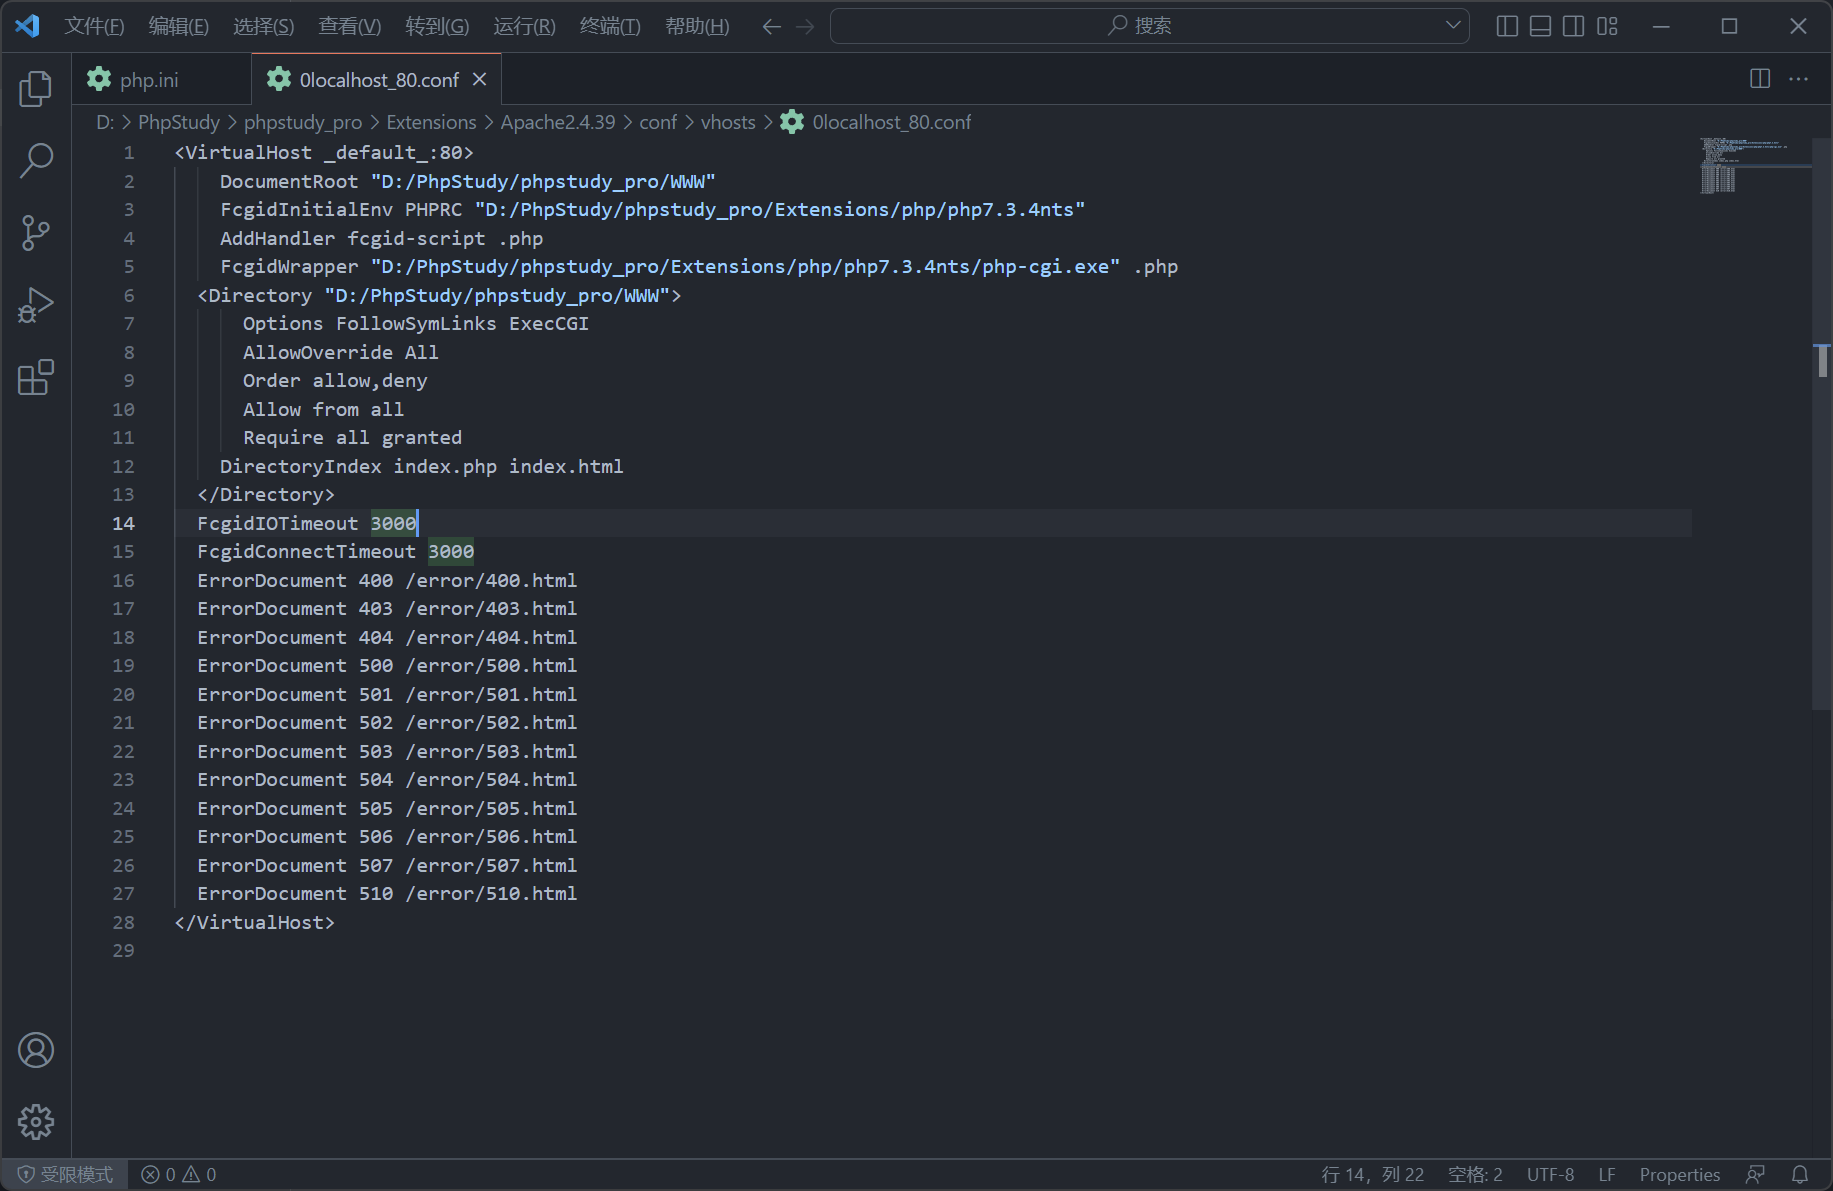
若调试的过程中出现 [500] 的错误,则修改中间价的配置文件。
FcgidIOTimeout 3000 # 程序响应超时时间
FcgidConnectTimeout 3000 # 与程序通讯的最长时间
提示
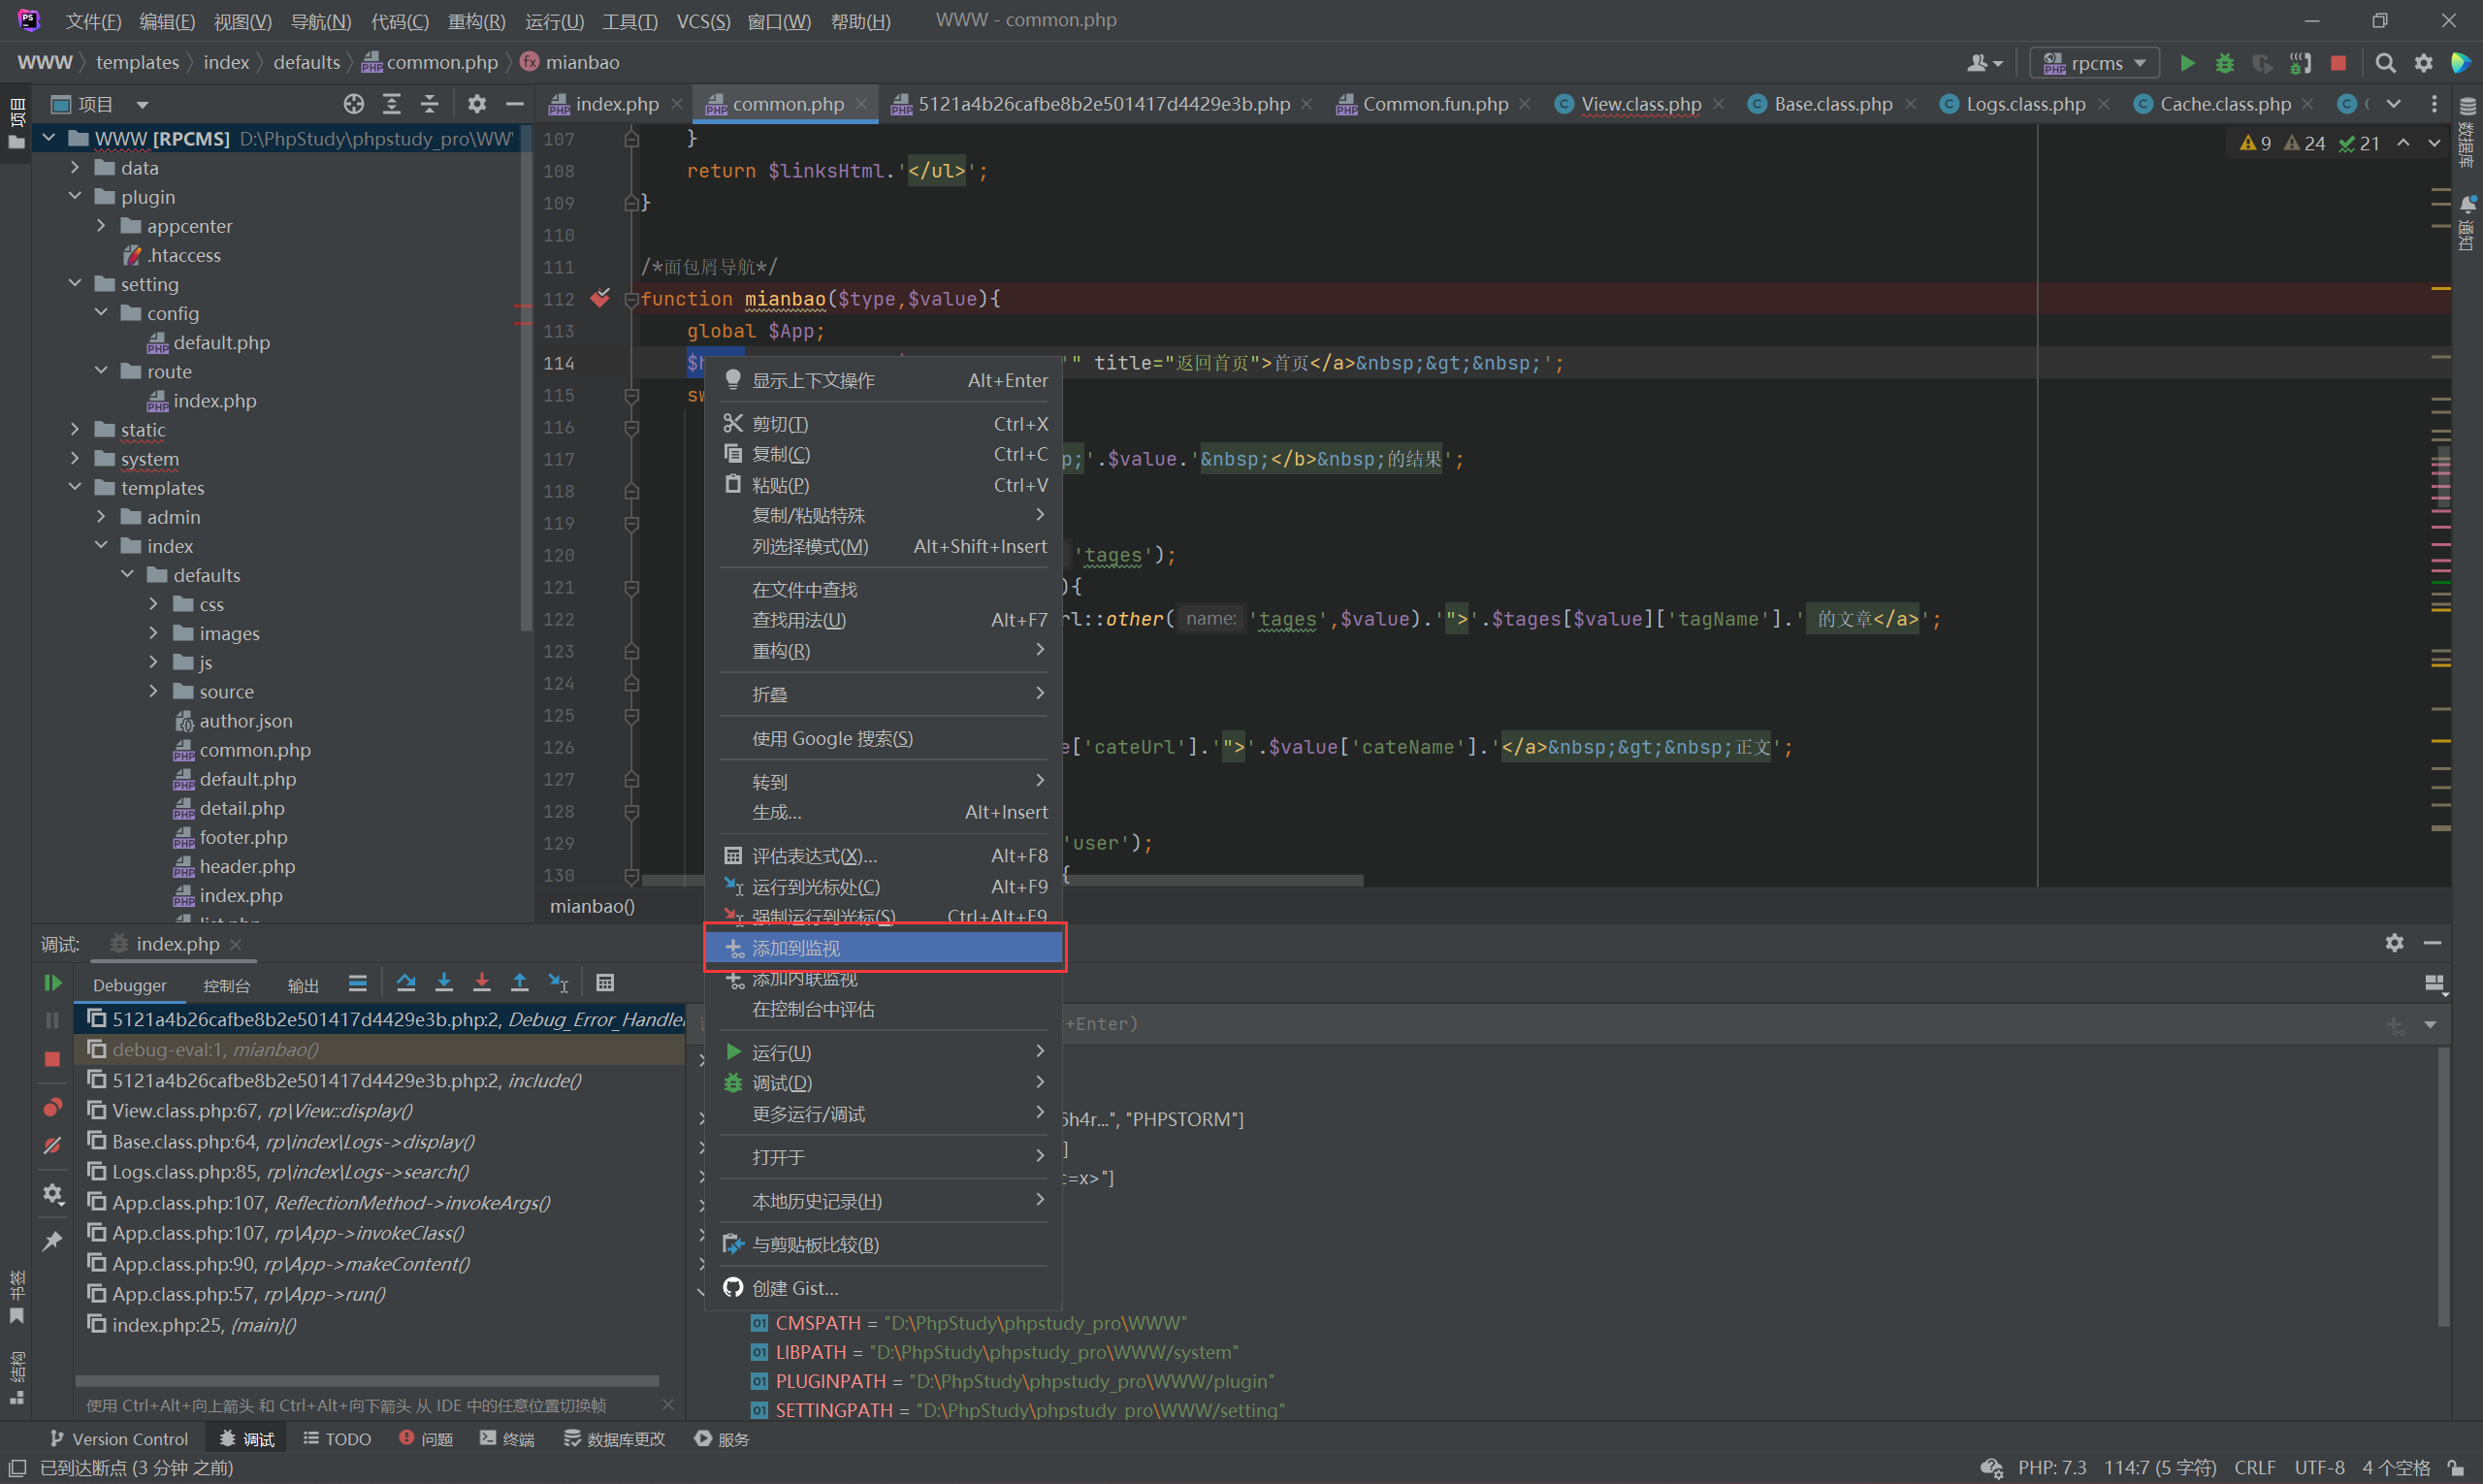
需要让变量出现在调试界面时,需要将显示的变量添加到监视。